

Discover how Oracle Financial Analytics revamp Business finance with real time insights
Introduction
In today’s data-driven landscape, leveraging Oracle Financial Analytics stands as a cornerstone for informed decision-making and strategic planning. As part of our initiative, we’ve implemented robust financial analytics on Google Cloud Platform (GCP / Looker ), harnessing data from Oracle EBS (E-Business Suite) to empower businesses with actionable insights.
Understanding Oracle Financial Analytics
Data analytics in finance involves the systematic analysis of financial data to extract valuable insights, facilitate budgeting, facilitate forecasting, and drive informed decisions. This encompasses various methodologies, including descriptive, diagnostic, predictive, and prescriptive analytics, to understand past performance, uncover trends, mitigate risks, and optimize future strategies. In nutshell Oracle financial analytics is one stop shop to analyze the overall financial health of an organization.
Deep Dive into General Ledger Journals and Balances KPIs and Dashboards
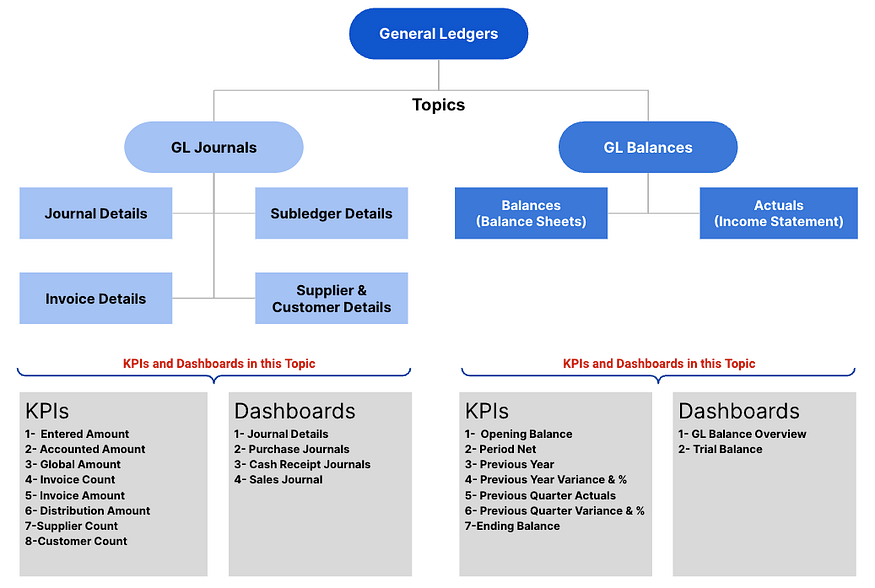
This articles covers 2 topics under General Ledger Module
- GL Journals ( Dashboards & KPIs )
- GL Balances ( Dashboards & KPIs )
1.1 GL Journals Dashboards
1.1.1 Journal Details Dashboard:
The Integrated GL Journals Details Dashboard stands out as a powerful tool offering a nuanced exploration of journal entries, uniquely providing insights at the levels of suppliers, customers, and invoices. This dashboard goes beyond traditional GL views, integrating seamlessly with Accounts Payable (AP) and Accounts Receivable (AR) to enhance visibility and facilitate robust account reconciliation between the General Ledger (GL) and subledger modules.

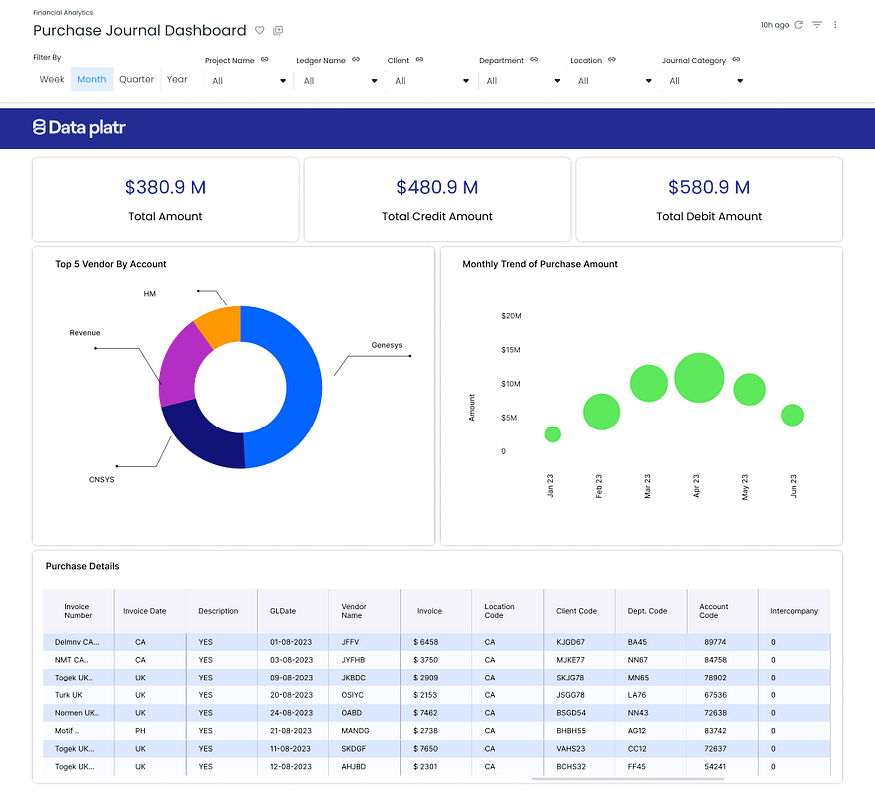
1.1.2 Purchase Journal Dashboard
The Purchase Journal Dashboard is a dedicated platform providing detailed insights into purchasing activities, with a primary focus on suppliers and associated invoices. This dashboard enables users to comprehensively explore the purchase journal, gaining valuable insights into supplier relationships and transaction details.
1.1.3 Cash Receipts Journal Dashboard
The Cash Receipt Journal Dashboard offers detailed insights into cash receipts from customers, providing valuable information about receipts made against accounts receivable (AR) invoices. This dashboard serves as a powerful tool for financial analysis and decision-making, allowing stakeholders to monitor and manage cash inflows effectively.

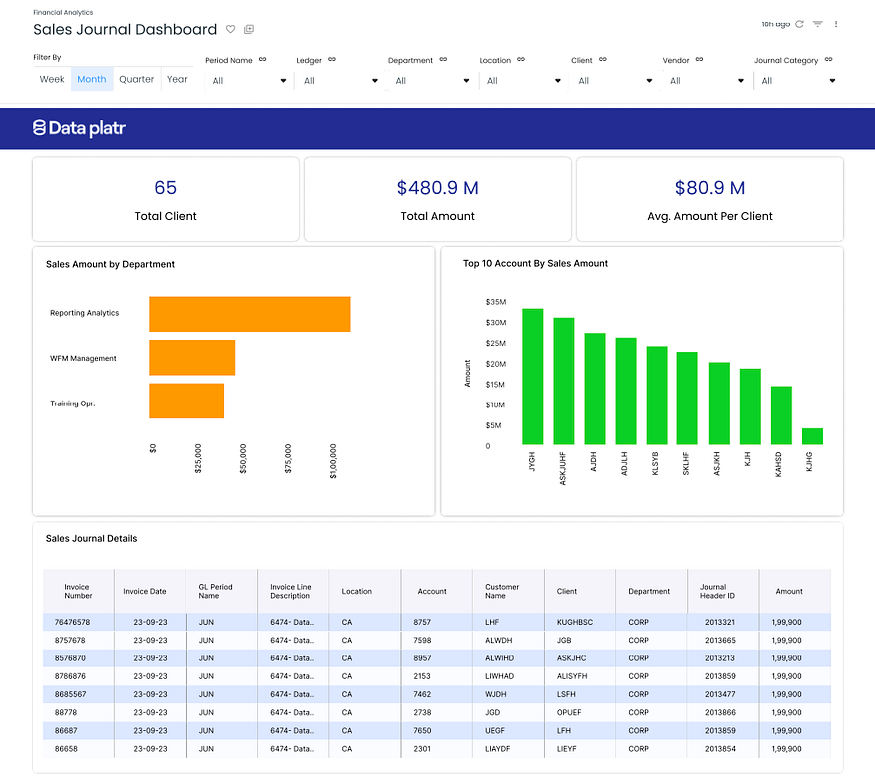
1.1.4 Sales Journal Dashboard
The Sales Journal Dashboard is a specialized tool tailored for in-depth insights into sales transactions, with a customer-centric focus. This dashboard provides a comprehensive analysis of the sales journal, emphasizing customer details and associated invoices.
1.2 GL Journals KPIs -
Entered Amount Credit
Entered amount credit helps in tracking the journal entry line credit amount in the transaction or entered currency. This metric can be grouped by period, ledger, account, department, segments, supplier, customer, invoice etc.
Entered Amount Debit
Entered amount debit helps in tracking the journal entry line debit amount in the transaction or entered currency. This metric can be grouped by period, ledger, account, department, segments, supplier, customer, invoice etc.
Net Entered Amount
This KPI shows the difference between entered amount credit and entered amount debit. This metric can be grouped by period, ledger, account, department, segments, supplier, customer, invoice etc.
Accounted Amount Credit
Accounted amount credit helps in tracking the journal entry line credit amount in the ledger currency. This metric can be grouped by period, ledger, account, department, segments, supplier, customer, invoice etc.
Accounted Amount Debit
Accounted amount debit helps in tracking the journal entry line debit amount in the ledger currency. This metric can be grouped by period, ledger, account, department, segments, supplier, customer, invoice etc.
Net Accounted Amount
This KPI shows the difference between accounted amount credit and accounted amount debit. This metric can be grouped by period, ledger, account, department, segments, supplier, customer, invoice etc.
Global Amount Credit
Global amount credit shows the accounted credit amount in the global currency (example USD) by applying appropriate currency conversion rates. It is an important KPI for doing a consolidated GL reporting across all ledgers. This metric can be grouped by period, ledger, account, department, segments, supplier, customer, invoice etc.
Global Amount Debit
Global amount debit shows the accounted debit amount in the global currency (example USD) by applying appropriate currency conversion rates. It is an important KPI for doing a consolidated GL reporting across all ledgers. This metric can be grouped by period, ledger, account, department, segments, supplier, customer, invoice etc.
Net Global Amount
This KPI shows the difference between global amount credit and global amount debit. It is an important KPI for doing a consolidated GL reporting across all ledgers. This metric can be grouped by period, ledger, account, department, segments, supplier, customer, invoice etc.
Invoice Count
Invoice count helps in tracking the number of AP or AR invoices that are recorded in purchase or sales journal.
Invoice Quantity
Invoice quantity helps in tracking the AP or AR invoice quantity against a purchase or sales journal.
Distribution Amount
For purchase and sales journals, distribution amount helps in tracking the amount recorded in AP and AR subledgers.
Supplier Count
For purchase journals, this metric helps in getting the distinct count of suppliers as per the invoices received in AP for a given period.
Customer Count
For sales journals, this metric helps in getting the distinct count of customers as per the invoices created in AR for a given period.
2.1 GL Balances Dashboards
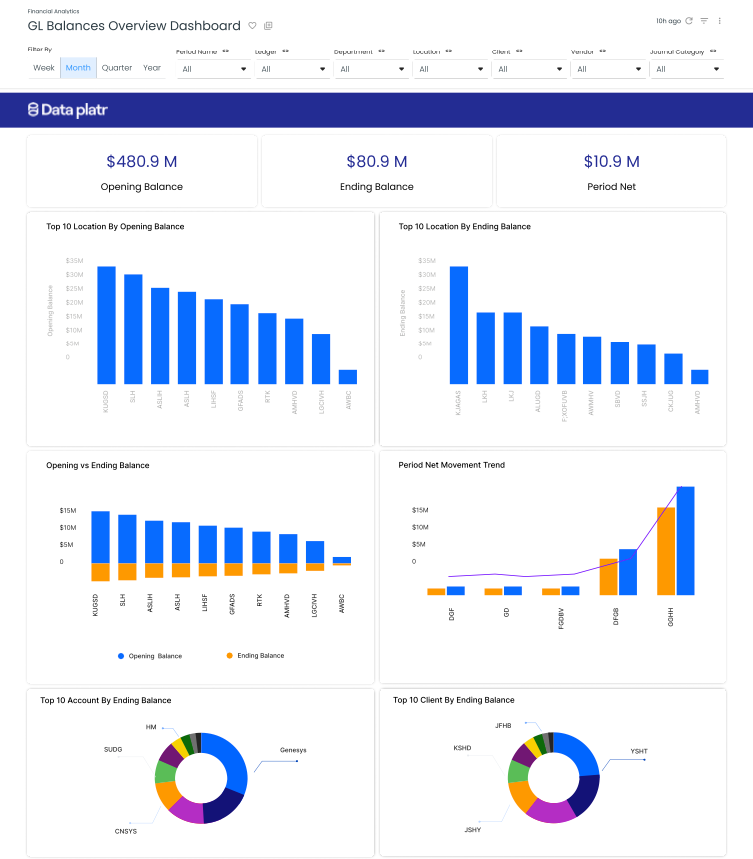
2.1.1 GL Balances Overview Dashboard
The dashboard provides a snapshot of Financial Data Analysis for a given fiscal period, offering key insights into the opening balance, period net movement (actuals), and ending balance. This dynamic dashboard allows users to analyze data at both the segment and hyperion hierarchy levels, promoting in-depth financial understanding and strategic decision-making.
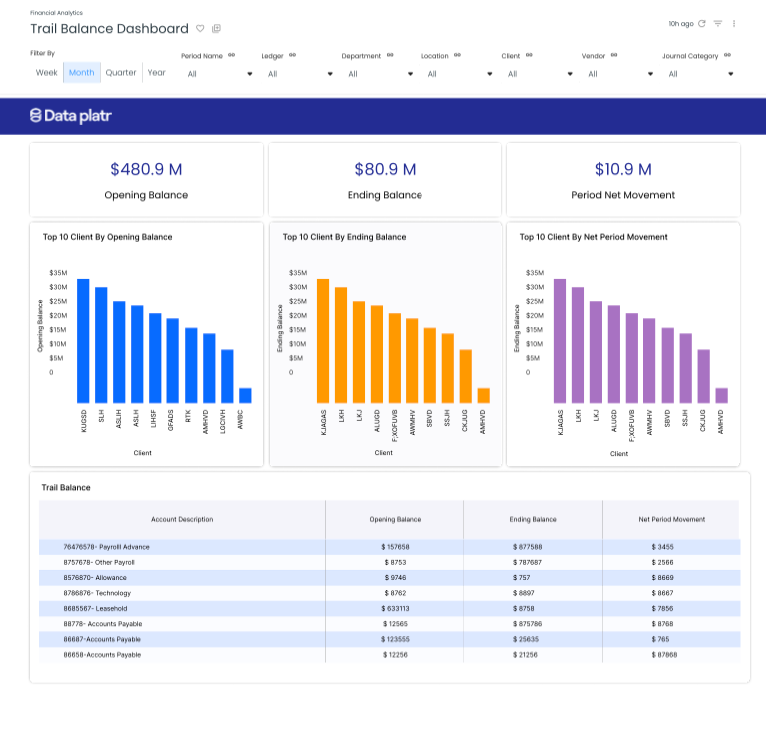
2.1.2 Trial Balance Dashboard
The Trial Balance Dashboard offers a comprehensive view of financial data, presenting opening balances, period net movements, and ending balances at the account level. This dynamic dashboard provides stakeholders with essential insights into the financial health and performance of the organization, facilitating informed decision-making and strategic planning.
2.2 GL Balances KPIs:
Opening Balance Debit
This KPI gives the opening balance debit for a period. This metric can be reported in transaction or ledger currency.
Opening Balance Credit
This KPI gives the opening balance credit for a period. This metric can be reported in transaction or ledger currency.
Opening Balance
This KPI gives the opening balance for a period which is calculated as opening balance debit minus opening balance credit.
Period Net Debit
This KPI gives the activity amount debit recorded for a period. This metric can be reported in transaction or ledger currency.
Period Net Credit
This KPI gives the activity amount credit recorded for a period. This metric can be reported in transaction or ledger currency.
Period Net Movement (Actuals)
This KPI gives the net period activity amount that is debit minus credit for a period. This metric can be reported in transaction or ledger currency
Previous Year Actuals
This KPI gives the previous year actuals for a given period. This metric can be reported at transaction or ledger currency level.
Previous Year Variance and Variance %
These KPI gives the variance between the current year actuals and previous year actuals. It is an important metric to evaluate if the financial numbers such as profit, revenue or expenses are going up or down when compared to previous year data. This metric can be reported at transaction or ledger currency level.
Previous Quarter Actuals
This KPI gives the previous quarter actuals for a given period. This metric can be reported at transaction or ledger currency level.
Previous Quarter Variance and Variance %
These KPI gives the variance between the current quarter actuals and previous quarter actuals. It is an important metric to evaluate if the financial numbers such as profit, revenue or expenses are going up or down when compared to previous quarter data. This metric can be reported at transaction or ledger currency level.
Ending Balance
This KPI gives the ending balance for a period which is calculated by summing transaction currency opening balance and period net movement. This metric can be reported in transaction or ledger currency
Conclusion
Each of these metrics provides critical insights into the performance and efficiency of the account payable processes. Analyzing these metrics helps in making data-driven decisions, optimizing journal analysis, data reconciliation, income statement and balance sheet reporting. The report assists managers and stakeholders in understanding the overall health and effectiveness of the general ledger processes.
How Data platr can help?
Data platr specializes in delivering cutting-edge solutions in the realm of Oracle financial Analytics with a focus on leveraging the power of Google Cloud Platform (GCP) / Snowflake / AWS. Through our expertise, we provide comprehensive analytics solutions tailored to optimize general ledger analysis and reconciliation. By harnessing the capabilities of cloud, we offer a robust framework for implementing advanced analytics tools, allowing businesses to gain actionable insights and make data driven decisions.
Curious And Would Like To Hear More About This Article?
Contact us at [email protected] or Book time with me to organize a 100%-free, no-obligation call
Frequently Asked Questions (FAQs)
1. What is Oracle Financial Analytics?
Oracle Financial Analytics is a business intelligence solution that offers pre-built analytics and KPIs for financial performance management. It enables organizations to gain insights from their Oracle E-Business Suite (EBS) data, helping improve decision-making, budgeting, and forecasting.
2. How does Oracle Financial Analytics benefit organizations?
Key benefits include:
- Real-time visibility into financial KPIs
- Scalable cloud-based architecture
- Interactive and customizable dashboards via Looker
- Integration with Oracle EBS for accurate reporting
- Improved financial planning and analysis (FP&A)
3. Can Oracle Financial Analytics can be customized to specific business needs?
Yes. With platforms like Looker and cloud-native data solutions, organizations can customize Oracle Financial Analytics to match unique business rules, chart of accounts structures, and financial reporting requirements.
4. Is this solution suitable for all types of businesses?
While the implementation is designed for organizations using Oracle EBS, the scalable nature of GCP and the flexibility of Looker make it adaptable for various business sizes and industries seeking advanced financial analytics.
5. How does Financial Analytics support finance and data analytics initiatives?
Financial Analytics bridges the gap between finance and data analytics by transforming raw financial data into meaningful insights. It empowers finance teams to make data-driven decisions, optimize financial operations, and align performance with business goals.