Contact Center Analytics : Unlock Call Details KPIs and Dashboard for actionable insights — Part 2

Why Contact Center Analytics?
Contact center is a centralized hub where customer interactions happen predominantly through Phone calls, Chats, & Social media interactions. Monitoring calls details is essential for understanding and optimizing the customer experiences and daily operations. Key aspects of Contact Center businesses include, tracking call volume, call durations, types of calls, agents tracking and the effectiveness of issue resolutions. These insights helps organizations gauge the workload, identify trends and ensure efficient handling of customer interactions.
Efficient contact center management necessitates a keen focus on concrete, trackable metrics across diverse operational aspects of the business. A well-structured dashboard incorporating these KPIs, empowers the management to make informed decisions, optimize workflows and consistently elevate customer satisfaction while ensuring compliance with regulatory standards. These metrics are the cornerstone for achieving operational excellence and delivering exceptional customer experiences.
If you haven’t had the chance to explore Part 1 of our article, we encourage you to start there for essential insights before delving into this chapter
Deep Dive into Calls Details KPIs and Dashboard
Lets discuss below, in-detail some of the many KPIs (Key Performance Indicators), their technical understanding, business relevance and sample visualizations.
Service Level %:
Service Level is a key performance indicator (KPI) that measures the percentage of incoming calls that are answered within a specific time frame. It reflects the efficiency and responsiveness of the contact center in handling customer inquiries and ensuring a timely resolution
Max Wait Times:
Max Wait Time is a crucial KPI representing the maximum amount of time a customer is expected to wait before being connected to an available agent. This metric is a vital component in ensuring a positive customer experience, as it directly impacts customer satisfaction and perception of service quality.
Abandon %:
Abandon% measures the percentage of callers who hang up or disconnect before connecting with an agent. This KPI provides insights into the efficiency and effectiveness of the contact center’s operations.
Average Handle Time(AHT):
AHT is a KPI that measures the average duration an agent takes to handle a customer interaction from start to finish. This metric includes the time an agent spends talking to the customer, as well as any additional time spent on related tasks such as after-call work or documentation.
Average Talk Time (ATT):
ATT is KPI that measures the average duration an agent spends actively engaged in conversation with a customer during a phone call. Unlike Average Handle Time (AHT), which includes the entire duration of an interaction from start to finish, ATT specifically focuses on the time agents spend talking to customers.
Average Hold Time:
Average Hold Time is the average amount of time a caller spends on hold before speaking with a live agent. It is a key metric that directly influences the customer experience and is an important aspect of overall Contact center performance.
Average Wrap Time (AWT):
AWT is the average amount of time an agent spends completing post-call tasks or “wrapping up” after a conversation with a customer. This includes activities such as call summarization, documentation, and any other tasks required to conclude the interaction.
Contact Center Analytics: Call Details KPI Dashboard
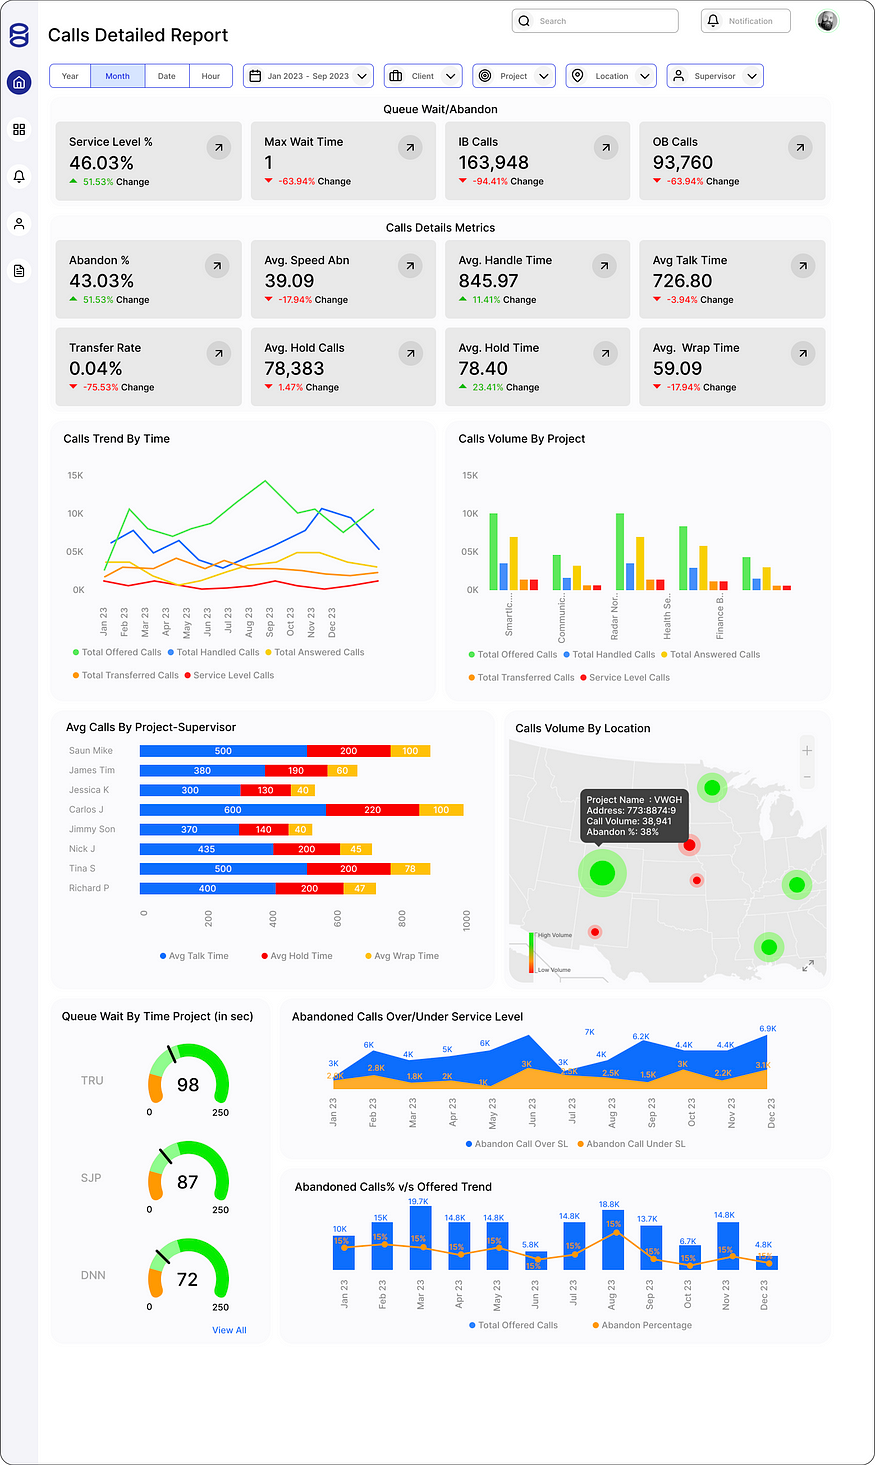
Calls Trends by Time:
This section presents a graphical representation of call volumes of different months. It highlights peak months and periods of low call activity, aiding in resource allocation and staffing optimization.
Call Volume by Project:
This segment breaks down the total number of calls received for each specific project or campaign. It offers a clear understanding of the distribution of call traffic among different initiatives or services.
Average Calls by Project Supervisor:
It outlines the average number of calls handled by each project supervisor or team leader. This metric assesses individual performance and workload management across different projects.
Calls Volume by Location:
This part details the total call volume received from various geographical locations or Contact center branches. It helps in understanding the regional distribution of calls and potential regional service needs.
Queue Wait by Project (in Seconds):
Queue wait time refers to the duration a caller spends waiting in the queue before being connected to an available agent. This metric is segmented by projects or campaigns, revealing the average wait times for each specific initiative.
Abandoned Calls Over/Under Service Level:
Abandoned calls occur when callers disconnect before connecting with an agent. This section of the report analyzes the percentage of abandoned calls compared to the predefined service level agreements (SLAs). It indicates whether the Contact center is meeting, exceeding, or falling short of the expected service levels for abandoned calls.
Conclusion:
Each of these metrics provides critical insights into the performance and efficiency of the Contact center operations. Analyzing these metrics helps in making data-driven decisions, optimizing resource allocation, improving customer service, and ensuring that service level targets are met. The report assists managers and stakeholders in understanding the overall health and effectiveness of the Contact center’s operations.
How Data platr can help ?
Data platr specializes in delivering cutting-edge solutions in the realm of Contact Center Analytics with a focus on leveraging the power of Google Cloud Platform (GCP) / Snowflake / AWS. Through our expertise, we provide comprehensive analytics solutions tailored to optimize contact center operations and enhance customer experiences. By harnessing the capabilities of Cloud, we offer a robust framework for implementing advanced analytics tools, allowing businesses to gain deep insights into call details, agent performance, and overall productivity.
Curious And Would Like To Hear More About This Article ?
Contact us at info@dataplatr.com or Book time with me to organize a 100%-free, no-obligation call
Follow us on LinkedIn for more interesting updates!!