Empowering Financial Decision-Making using Databricks and Power BI Insights
Content Covered in this Article
1. Introduction
In today’s data-driven landscape, leveraging financial analytics stands as a cornerstone for informed decision-making and strategic planning. As part of our initiative, we’ve implemented robust financial analytics on Databricks, harnessing data from Oracle EBS (E-Business Suite) to empower businesses with actionable insights in Power BI.
2. Understanding Financial Analytics
Financial analytics involves the systematic analysis of financial data to extract valuable insights, facilitate budgeting, facilitate forecasting, and drive informed decisions. This encompasses various methodologies, including descriptive, diagnostic, predictive, and prescriptive analytics, to understand past performance, uncover trends, mitigate risks, and optimize future strategies. In nutshell financial analytics is one stop shop to analyze the overall financial health of an organization.
3. Key Components of Our Solution
- Data Sourcing from Oracle EBS: We’ve successfully extracted and processed crucial financial data from oracle E-Business Suite, ensuring accuracy and reliability.
- Cloud-based Data Storage and Processing: Utilizing databrick’s scalable infrastructure, we’ve stored data in S3 bucket and processed large volumes of financial data efficiently through databricks. We have access to an end-to-end data pipeline solution for ingesting, transforming, processing, scheduling and delivering data.
- Analytics and Visualization: We have made use of the Power BI application to translate complex data into actionable insights.
- Self-Service: Extensive Power BI semantic layers and data models are built to facilitate self-service for the user’s by ensuring all the required fields are available in the semantic model.
- Hyperion Data Integration: A seamless process is deployed to integrate data from Oracle EBS with Hyperion
- Security: Robust security setup controls the authentication and authorization, to ensure only authorized users can access the tool and the data.
4. Databricks Reference Architecture
Data from the Oracle EBS and Oracle Hyperion are initially ingested into an S3 bucket. Following this, the data undergoes a series of transformations: first into the Bronze layer via Databricks, then into the Silver layer schema, with incremental load implemented between these layers. The data is further cleansed and transformed to meet business requirements in the Gold layer, facilitated by Databricks SQL notebooks.
This workflow, encompassing Bronze, Silver, and Gold layer scripts, runs automatically on a daily basis using Databricks Schedule & Triggers. Throughout this process, data is denormalized according to predefined data models and adheres to naming standards and conventions. Finally, PowerBI accesses the Gold layer for reporting purposes, ensuring alignment with business needs.
5. Finance Analytics — Data Flow
5.1 Keys Processes
- Data from the source system (Oracle EBS and Hyperion) is ingested into ODS stage schema through Databricks application, the source data is first landed into S3 bucket in csv format and then inserted into the Bronze layer schema. After the initial load, the data from source is pulled incrementally into the S3 bucket.
- Then the data is ingested into the Silver layer schema. This merging of data from the Bronze layer to Silver layer of databrick is implemented in the Databricks itself.
- Once the data is merged from Bronze to Silver layer schema, the data files that were created in the S3 bucket are moved to an archived location within the S3 bucket.
- From Silver layer to Gold layer (EDW) the data mart is cleansed and transformed according to the business requirement through the notebooks of databricks.
- Finally, from the Gold layer (EDW) schema the data is consumed into the Gold layer EDWBI schema using databrick’s notebook. In this layer additional database objects such as aggregates, snapshots etc. are created.
- The workflow jobs are executed on a daily basis to get the most recent data from the source.
- The execution of the workflow jobs is automated using the Databricks scheduler.
- Power BI is connected to EDWBI layers for all the reporting needs.
6. Databricks Workflow — Example
Databricks Workflows used for data processing, analytics pipelines and orchestrating. Here we have shown one pipeline example for the finance AP module.
In the above example, each job is connected with a notebook.
AWS Bucket Connection
The first step in the workflow, this notebook is basically establishing the connection between oracle EBS to S3 bucket.
Source Table list File Validation
This is the second step of the workflow which basically validates the table list file. In the table list we provide table details which table’s data we want to process from source to bronze layer.
Bronze Layer
In this step, Data is loaded from source to bronze layer based on the incremental flag mentioned in the table list file. Some tables are incremental load and some are full load every time. We have handled both types of scenarios in the Bronze layer step.
Silver Layer
In this step, data is transferred to the Bronze to Silver layer with some transformation. Silver layer also handles the CDC approach for incremental loaded data. It updates the audit columns for auditing purposes.
Inactive Indicator
In this step we have handled the Soft delete and Hard delete columns to create the correct results in the Gold layer.
Golden layer
In this step, we are creating the first golden layer table based on the business requirement.
Furthermore, in the first level of the Gold layer schema data is consumed into the second level of Gold layer schema using databrick’s notebook. In this layer additional database objects such as aggregates, snapshots etc. are created. In the above screenshot we have the following first and second layer of golden tables.
First layer of Golden layer tables –
Accounting_InvoiceDistributions, Accounting_APInvoicePaymentSchedule
Second layer of Golder layer tables-
Accounting_APInvoiceDistributions, Accounting_APInvoiceAggregate, Accounting_APInvoiceAging, Accounting_APInvoicePaymentScheduleAggregate
6.1 Databricks Workflow — Schedules & Triggers
Moreover, we have used the Databricks native scheduler to schedule the workflow on a daily frequency.
In Databricks, we have three different types of triggers for workflow.
- Scheduled
- File Arrival
- Continues
Based on the requirement we can set up the workflow triggers.
7. Finance Analytics — Data Model
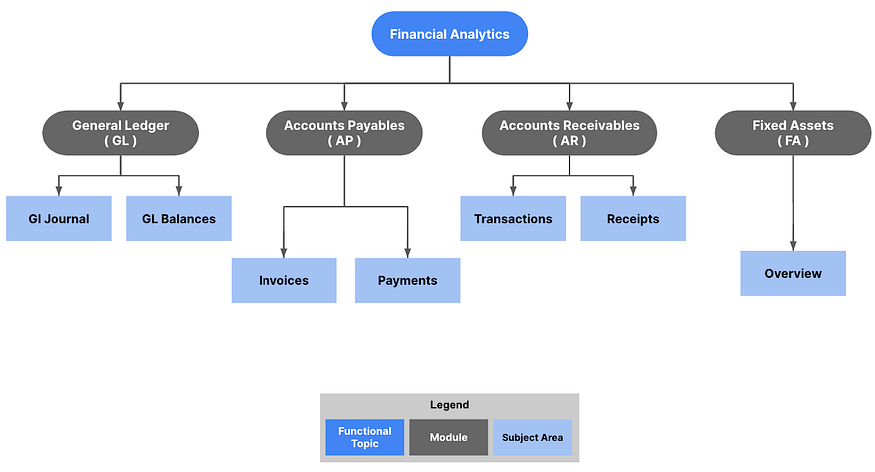
In Financial Analytics, four distinct data models have been developed to meet specific business needs.
1. General Ledgers
2. Account Payable
3. Account Receivable
4. Fixed Assets
We created the reports in Power BI for the above data models. To manage different models and audiences in Finance, we used the Power BI app feature.
App is used for creating packaged content and distributing the content to the broader audiences. An app combines related content, like dashboards, spreadsheets, semantic models, and reports, all in one place. An app has one or more of each content type bundled together. Here we have created “Finance Workspace” as an app.
In the Finance workspace, we separated the teams by creating audiences. The GL team can access GL reports, the AP team can access AP reports and so on and so forth. On top of that we allocated the roles to users/groups to allow them to access accordingly. Power BI supports four types of roles.
- Viewer — This role provides read only access to workspace items. Read access does provide report / dashboard consumers the ability to not only view, but also interact with visuals. Interaction does not mean changing a visual.
- Contributor– This role can access and interact with reports and dashboards. Additionally, this role can create, edit, copy, and delete items in a workspace, publish reports, schedule and refreshes.
- Member — This role can access and interact with reports and dashboards. Additionally, this role can create, edit, copy, and delete items in a workspace, publish reports, schedule refreshes, and modify gateways. Finally, members of this role can also feature dashboards on the service, share items, allow others to reshare items, publish or republish an APP.
- Admin — This role can do all the functions above plus add and remove all users including other Admins.
By this way we implemented the security infrastructure in the Power BI.
7.1 General Ledgers Dashboards & KPIs
General ledger (GL) is a set of numbered accounts a business uses to keep track of its financial transactions and to prepare financial reports. Each account is a unique record summarizing a specific type of asset, liability, equity, revenue or expense. The dashboard provides a snapshot of financial data for a given fiscal period, offering key insights into the opening balance, period net movement, and ending balance. This dynamic dashboard allows users to analyze data at both the segment and hyperion hierarchy levels, promoting in-depth financial understanding and strategic decision-making.
7.1.1 GL Journals Dashboards
A) Sales Journal Dashboard
The Sales Journal Dashboard is a specialized tool for in-depth insights into sales transactions, with a customer-centric focus. This dashboard provides a analysis of the sales journal, emphasizing customer details and associated invoices.
B) Purchase Journal Dashboard
The Purchase Journal Dashboard is a tool for in-depth insights into purchase transactions.This dashboard provides a comprehensive analysis of the purchase journal, emphasizing customer details and associated invoices.
C) Cash Receipts Dashboard
The cash receipts journal is that type of accounting journal that is only used to record all cash receipts during an accounting period and it shows the receipts debit what comes in and credits what goes out.
7.1.2 GL Balances Dashboard
The GL Balances Dashboard is a tool for in-depth insights into balance transactions. This dashboard provides an analysis on the Balances, Net amount and Actuals.
7.1.3 General Ledgers KPIs
Invoice Count: Invoice count helps in tracking the number of AP or AR invoices that are recorded in purchase or sales journal.
Invoice Quantity: Invoice quantity helps in tracking the AP or AR invoice quantity against a purchase or sales journal.
Distribution Amount: For purchase and sales journals, distribution amount helps in tracking the amount recorded in AP and AR subledgers.
Supplier Count: For purchase journals, this metric helps in getting the distinct count of suppliers as per the invoices received in AP for a given period.
Customer Count: For sales journals, this metric helps in getting the distinct count of customers as per the invoices created in AR for a given period
Entered Amount Credit: Entered amount credit helps in tracking the journal entry line credit amount in the transaction or entered currency. This metric can be grouped by period, ledger, account, department, segments, supplier, customer, invoice etc.
Entered Amount Debit: Entered amount debit helps in tracking the journal entry line debit amount in the transaction or entered currency. This metric can be grouped by period, ledger, account, department, segments, supplier, customer, invoice etc.
Net Entered Amount: This KPI shows the difference between entered amount credit and entered amount debit. This metric can be grouped by period, ledger, account, department, segments, supplier, customer, invoice etc.
Accounted Amount Credit: Accounted amount credit helps in tracking the journal entry line credit amount in the ledger currency. This metric can be grouped by period, ledger, account, department, segments, supplier, customer, invoice etc.
Accounted Amount Credit: Accounted amount debit helps in tracking the journal entry line debit amount in the ledger currency. This metric can be grouped by period, ledger, account, department, segments, supplier, customer, invoice etc.
Net Accounted Amount: This KPI shows the difference between accounted amount credit and accounted amount debit. This metric can be grouped by period, ledger, account, department, segments, supplier, customer, invoice etc.
Global Amount Credit: Global amount credit shows the accounted credit amount in the global currency (example USD) by applying appropriate currency conversion rates. It is an important KPI for doing a consolidated GL reporting across all ledgers. This metric can be grouped by period, ledger, account, department, segments, supplier, customer, invoice etc.
Global Amount Debit: Global amount debit shows the accounted debit amount in the global currency (example USD) by applying appropriate currency conversion rates. It is an important KPI for doing a consolidated GL reporting across all ledgers. This metric can be grouped by period, ledger, account, department, segments, supplier, customer, invoice etc.
Net Global Amount: This KPI shows the difference between global amount credit and global amount debit. It is an important KPI for doing a consolidated GL reporting across all ledgers. This metric can be grouped by period, ledger, account, department, segments, supplier, customer, invoice etc.
7.2 Account Payable Dashboards & KPIs
Account Payable dashboard offers a holistic view of the end-to-end lifecycle of invoices, providing crucial insights into the efficiency and performance of the invoice payment process. It shows payment related key KPIs to provide an end to end invoice lifecycle.
7.2.1 Payments Dashboards
A) AP Overview
The AP overview dashboard provides the insights of the life cycle of invoices, providing crucial insights into the efficiency and performance of the Accounts Payable process.
B) AP Aging
The AP Aging Dashboard is designed to provide a view of unpaid invoices, categorized into age buckets. This enables quick identification of outstanding payment trends and helps in assessing the financial health of the accounts payable process.
7.2.2 Invoices Dashboards
A) AP Invoices Dashboard
B) AP Invoices on Hold
The AP Invoice Hold Dashboard is designed to provide insights into invoices that are placed on hold. It focuses on showcasing the top reasons for holds and identifies the key suppliers whose invoices are frequently held. The main key performance indicators (KPIs) tracked are the hold amount and the count of invoices on hold.
7.2.3 Account Payable KPIs
- Invoice Amount: Invoice amount is one of the key KPI that helps in tracking the total amount of invoices that were processed in a given period.
- Overdue Amount: This KPI shows the amount against the invoice that has passed their due dates but the payment is yet not done. This metric can help in identifying the scenarios leading to payment delays hence assist in improving the payment performance.
- Invoice Count : Invoice count helps in tracking the number of AP invoices that were processed in a given period.
- Hold Count : This KPI gives the count of the invoices that were put on hold. Double click on to such invoices to determine the reason due to which the invoice was put on hold.
- Hold Amount : This KPI gives the amount against the invoices that were put on hold. Double click on to such invoices to determine the reason due to which the invoice was put on hold.
- Supplier Count : This KPI helps in getting the distinct count of suppliers who raised the AP invoices in a given period.
- Average Invoice Amount: This KPI gives the average invoice amount to measure the mean invoice amount that was raised in a given period.
- Balance Amount: This KPI gives the outstanding AP amount as of a given period. This is a key KPI to the total AP liability as of a given period. Monthly snapshots are taken to derive the outstanding amount as of each month so that month on month analysis can be enabled to see if the AP liability is going up or down.
- AP Aging by Invoice Date : This KPI shows the aging amount for the open invoices based on invoice date grouped by selected period.
- AP Aging by Invoice Creation Date : This KPI shows the aging amount for the open invoices based on invoice creation date in oracle EBS grouped by selected period.
- AP Aging by Invoice Received Date: This KPI shows the aging amount for the open invoices based on invoice received date grouped by selected period.
- Open Invoices Count : This KPI gives the total count of invoices that are yet to be paid as of a given period.
- Distribution Invoice:This KPI helps in identifying the invoices where differences in invoice amount and invoice distribution amount is observed. Invoice amount comes from the invoice header while the invoice distribution amount comes from the invoice distributions. In an ideal scenario both the amounts at header and distribution level should be the same hence this KPI can help in finding the anomalies
- Payment Amount: Payment amount reflects the total payment done against the AP invoices in a given period. This KPI is one of the vital indicators to understand the overall payment performance efficiency.
- Payment Count : Payment count gives the number of payments that were processed in a given period. This as well is an indicator to measure the overall payment performance efficiency.
- Early Payment: This KPI gives the count of the invoice payments that were done before their due dates. This again is one of those KPI that will help in analyzing the overall payment performance efficiency.
- Ontime Payment: This KPI gives the count of the invoice payments that were done as per their due dates. This again is one of those KPI that will help in analyzing the overall payment performance efficiency.
- Late Payment: This KPI gives the count of the invoice payments that were done after their due dates. This again is one of those KPI that will help in analyzing the overall payment performance efficiency.
- Average Supplier Payment Days: This KPI gives the average number of days it takes to do the supplier payments
- Check Amount: This amount reflects the actual payment that is done against an invoice. It helps in tracking the cash disbursement done in a given period.
7.3 Account Receivable Dashboards & KPIs
Account Receivable offers a view of the end-to-end lifecycle of accounts receivables, providing insights into AR transactions, due/balance amounts, invoices, journals, and customer-level information. This dynamic dashboard serves as a tool for financial analysis and decision-making, enabling stakeholders to monitor and manage AR processes effectively
7.3.1 Transactions Dashboards
A) AR Transaction Summary Dashboard
B) AR Aging
This AR aging dashboard provides insights on age buckets by AR transactions, due/balance amounts, invoices, journals, and customer-level information.
7.3.2 Account Receivable KPIs
- Invoice Amount : Invoice amount is one of the key KPI that helps in tracking the total amount against the invoices that were processed in a given period.
- Credit Memos Amount : This amount is one of the key KPI that helps in tracking the total amount against the credit memos that were processed in a given period.
- Debit Memos Amount : This amount is one of the key KPI that helps in tracking the total amount against the debit memos that were processed in a given period.
- Transaction Amount : Transaction amount shows the sum of invoice amount, debit memos amount and credit memos amount.
- Invoice Count : Invoice count helps in tracking the number of AR invoices that were processed in a given period
- Credit Memos Count : Credit memos count helps in tracking the number of credit memos that were processed in a given period.
- Debit Memos Count : Debit memos count helps in tracking the number of debit memos that were processed in a given period.
- Customer Count: This KPI helps in getting the distinct count of customers to whom the AR invoices are raised in a given period.
- Balance Amount: This KPI gives the outstanding AR amount as of a given period. Monthly snapshots are taken to derive the outstanding amount as of each month so that month on month analysis can be enabled to see if the outstanding AR is going up or down.
- AR Aging by Invoice Date: This KPI shows the aging amount for the open invoices based on invoice date grouped by selected period.
- AR Aging by Schedule Date: This KPI shows the aging amount for the open invoices based on payment schedule date in oracle EBS grouped by selected period.
- Receipts Amount : Receipts or payment amount reflects the total payment received from a customer against the AR invoices in a given period. This KPI is one of the vital indicators to understand the overall invoice payment recovery efficiency.
- Receipt Count : Receipt count gives the number of payments that were processed in a given period. This as well is an indicator to measure the overall invoice payment recovery efficiency.
- Early Receipt : This KPI gives the count of the AR invoice payments that were done before their due dates.
- Ontime Receipt : This KPI gives the count of the AR invoice payments that were done as per their due dates. This along with early payment KPI helps in tracking the customer who repays on or before the payment scheduled.
- Late Receipt: This KPI gives the count of the AR invoice payments that were done after their due dates. This will help in tracking the defaulter which means the customers who are not paying on time.
- Open Invoices Count: This KPI gives the total count of invoices that are yet to be paid by the customers as of a given period.
7.4 Fixed Assets Dashboards & KPIs
Assets offers an overview of asset cost and accumulated depreciation by category. This dashboard serves as a tool for financial analysis to gain visibility into all financial transactions affecting asset value.
7.4.1 Asset Overview
7.4.2 Fixed Assets KPIs
Asset Original Cost : Asset Original cost is the amount which cost incur by the company to purchase it. It shows the actual cost to the company.
Asset Current Cost : Asset current cost shows the value/ cost of the asset in present. It calculates after the depreciation cost.
Depreciation Reserve Amount : Depreciation reserves are amounts established by a business for expensive items that depreciate overtime and must be replaced. The business puts money into the reserve every year according to the amount the item depreciates and its salvage value.
Net Book Value: Net book value is the historical cost of an asset, less any amounts recorded for depreciation, amortization, or depletion. It is a product of fair value reporting that requires assets be reported at their market value.
Total Units: it shows the number of units in any asset.
Units Retired: It shows the number of units in which are retired with or without replacement, are accounted for by crediting the book cost.
Total Life : An asset is an estimate of the number of years it will remain in profitable service. The purpose of a useful life estimate is to determine how long an asset will remain in usable condition.
Remaining Life : The estimated age of an asset in comparison with a new asset of like kind and often calculated by deducting the remaining useful life of an asset from the normal useful life.
8. Benefits of Our Solution
Informed Decision-Making: Empowering stakeholders with timely and accurate insights for strategic decision-making.
Operational Efficiency: Streamlining financial processes, optimizing resource allocation, and identifying cost-saving opportunities.
Scalability and Flexibility: Databrick’s scalable infrastructure facilitates handling large datasets while offering flexibility in adapting to evolving business needs.
Compliance and Security: Ensuring data integrity, privacy to maintain trust and credibility.
Multiple System Integration: Seamless integration between Oracle EBS and Hyperion systems.
One Stop Solution: One stop solution for all the financial data needs.
9. Conclusion
Our implementation of financial analytics on databricks represents a commitment to harnessing the power of data for strategic advantage. By leveraging databrick’s robust infrastructure, we empower businesses to make informed decisions, mitigate risks, and drive sustainable growth in an ever-evolving market landscape.
10. How Dataplatr Can Support?
Dataplatr Inc. is a Databricks Partner specializes in data engineering & analytics with pre-built data models for Enterprise Applications like Oracle EBS, Workday, Salesforce to empower businesses to unlock the full potential of their data. Our pre-built enterprise data engineering models are designed to expedite the development of data pipelines, data transformation, and integration, saving you time and resources.
Our team of experienced data engineers, scientists and analysts utilize cutting-edge data infrastructure into valuable insights and help enterprise clients optimize their Sales, Marketing, Operations, Financials, Supply chain, Human capital and Customer experiences.
Curious and would like to hear more about this article ?
Contact us at Info@dataplatr.com or Book time with me to organize a 100%-free, no-obligation call

Follow us on LinkedIn for more interesting updates!!