Maximizing People Analytics with the Power of Databricks Lakehouse Platform and Omni Analytics
This article serves a preview for People Analytics KPIs and Dashboards using Databricks Lakehouse Platform and Omni Analytics
Content Covered in this Article
1. Databricks Overview
The Databricks platform enables organizations to effectively manage, utilize and access all their data The platform built on the lakehouse architecture, with a unified governance layer across data and AI and a single unified query engine that spans ETL, SQL, AI and BI — combines the best elements of data lakes and data warehouses to help reduce costs and deliver faster data.
With the Databricks Lakehouse Platform, data engineers have access to an end-to-end data pipeline solution for ingesting, transforming, processing, scheduling and delivering data. The Lakehouse Platform automates the complexity of building and maintaining pipelines and running ETL workloads directly on a data lake so data engineers can focus on quality and reliability to drive valuable insights.
2. Omni Analytics Overview

3. People Analytics – Architecture in Databricks
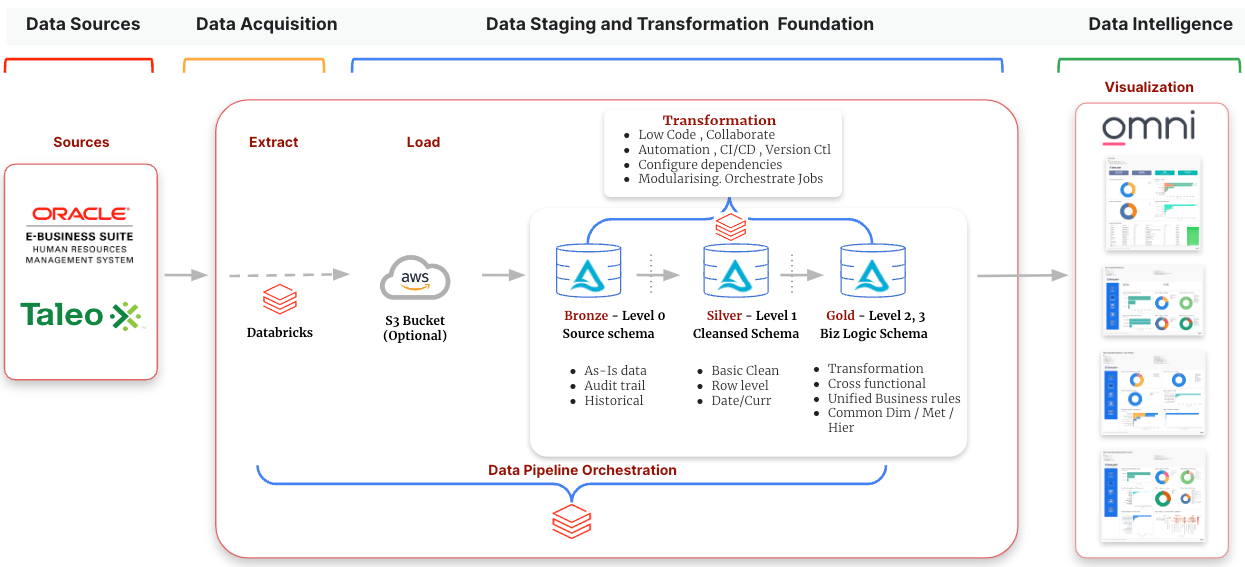
Data from the Oracle EBS HR module is initially ingested into an S3 bucket. Following this, the data undergoes a series of transformations: first into the Bronze layer via Databricks, then into the Silver layer schema, with incremental load implemented between these layers. The data is further cleansed and transformed to meet business requirements in the Gold layer, facilitated by Databricks SQL notebooks. This workflow, encompassing Bronze, Silver, and Gold layer scripts, runs automatically on a daily basis using Databricks Schedule & Triggers. Throughout this process, data is denormalized according to predefined data models and adheres to naming standards and conventions. Finally, Omni accesses the Gold layer for reporting purposes, ensuring alignment with business needs.
4. People Analytics – Data Flow
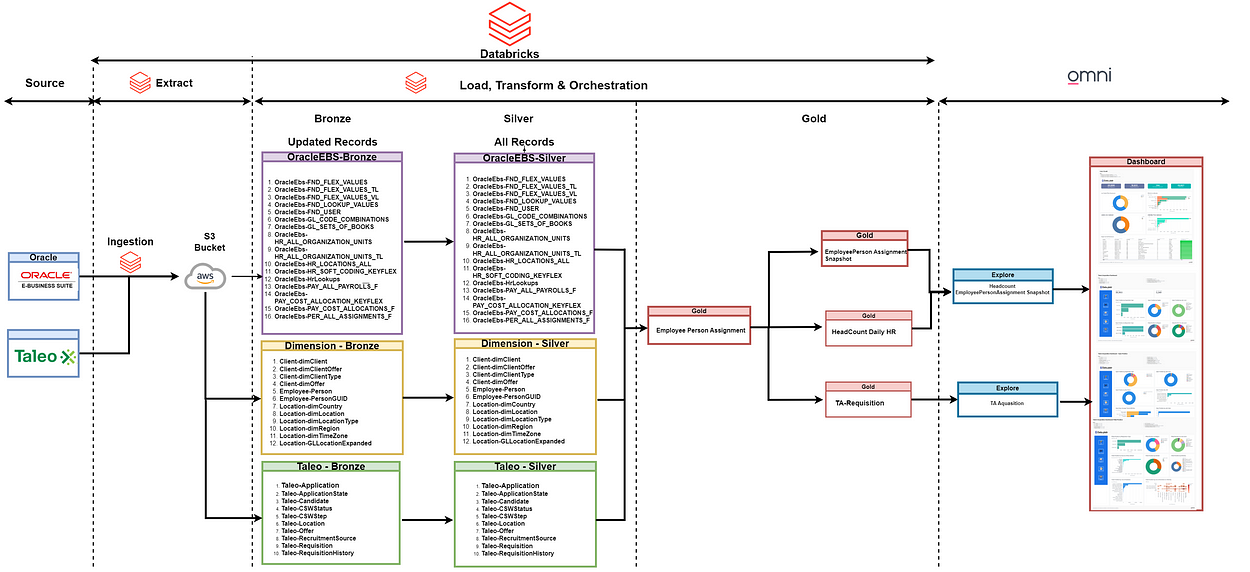
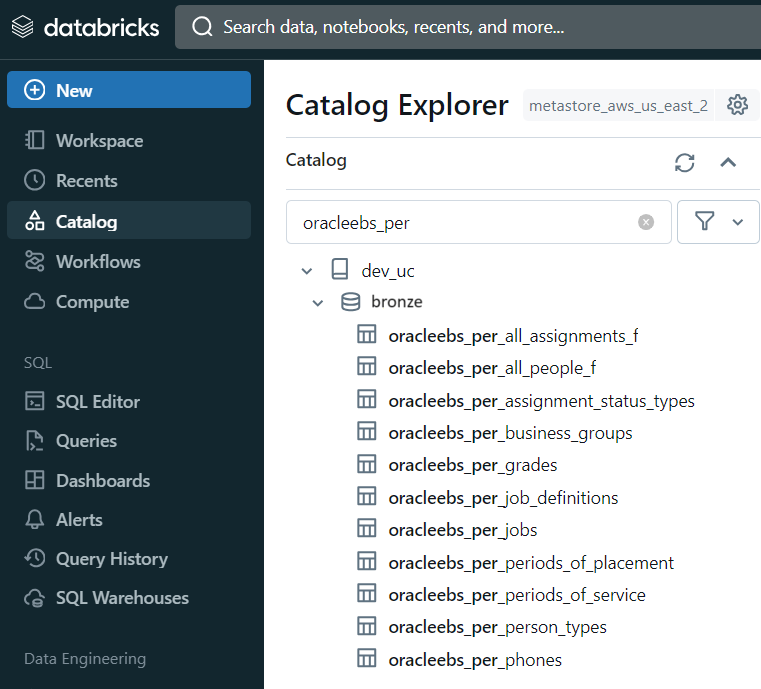
Data migrates from Oracle EBS People & Taleo Talent Acquisition to the Databricks ecosystem, hosted on AWS cloud. Initially, source data is loaded into an AWS S3 bucket in CSV format using Databricks, initiating the data replication process. One-to-one target tables are then created within the Databricks catalog to store the EBS table data.
Following data replication in the Silver layer, desired transformations are applied to generate the final Gold layer tables, facilitated by Databricks SQL-based notebooks.
Ultimately, Omni Analytics utilizes this transformed data to generate reports and actionable insights.
5. Change Data Capture ( CDC ) in Databricks
What is Change Data Capture ( CDC )
Change Data Capture (CDC) is a technique employed to monitor alterations in data, enabling the efficient capture and processing of updates, inserts, and deletes. Implemented through Python scripting in Databricks, this approach ensures that only modified data is processed, minimizing redundant computations and enhancing data processing efficiency.
CDC Implementation in Databricks
Applying the CDC concept occurs within the Silver layer during the data transition from Bronze to Silver. Below is a code snippet demonstrating the verification of the maximum CDC load date. The CDC logic is specifically implemented within People Analytics.
A table named CDCUpdate has been established to store table names and their respective maximum Last Updated Dates. Additionally, a parameter labeled Initial Load Date is configured with a value of ‘2020–01–01 :00:00:00’, utilized during the initial ingestion of tables.
During the data loading process into the Bronze layer table, the system checks the Last Update Date from the CDCUpdate table. If this date is null (indicating the first-time ingestion of the table), the data is loaded after the Initial Load Date.
Subsequently, the data is transferred from the Bronze layer to the Silver layer dataset within Databricks.
The CDC methodology is implemented within the SQL queries embedded in the Databricks notebook. These queries retrieve data from Oracle EBS based on the last update date, extracting only the records that have been altered or updated since the last successful execution.
By filtering data based on the last update date, the system processes only the delta changes, minimizing redundancy and optimizing data processing resources.
6. How is Hard/Soft Deletes at source handled in Databricks
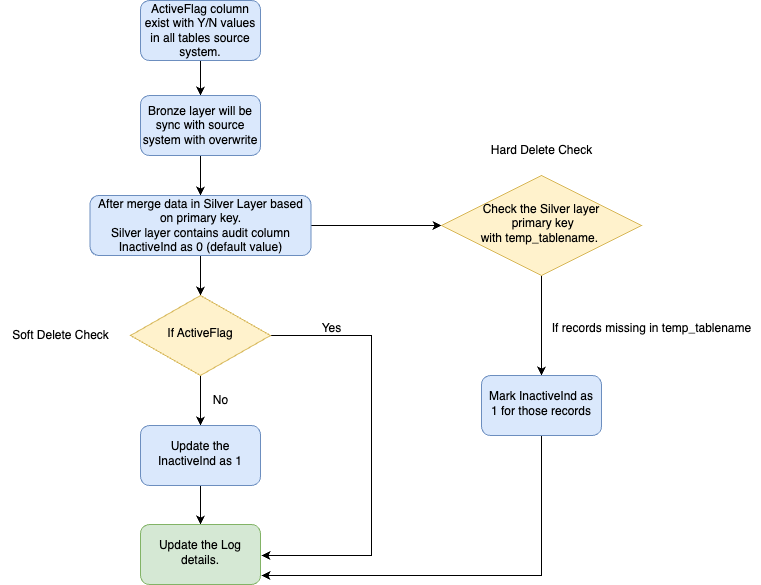
We’ve introduced an inactive indicator to label records as “Inactive” when they are either hard-deleted from the source system or soft-deleted (marked as “Active Flag” as “No”). This indicator facilitates the processing and segregation of inactive record data. With the inactive indicator, the Gold layer will be structured to include only active records. The default value of the inactive indicator is set to False.
Soft Delete
Soft delete refers to records marked with an Active Flag set to False in the source system. During the data processing from Source to Bronze and Silver layers, the Active Flag is updated to False in the Silver layer. Subsequently, based on the Active Flag being False, the Inactive Indicator is updated to True.
Hard Delete
Hard delete refers to records manually deleted from the source system. When processing data for the Bronze layer, a temporary table is created containing all primary key records from the source. This temporary table serves as a full load for primary keys only. After processing data in the Silver layer, the Silver layer records are compared with the temporary table. Any records missing from the temporary table are then marked with an Inactive Indicator set to True.
Below is the code snippet responsible for updating the Inactive Indicator flag upon the completion of the Silver layer update.
Here is the workflow for the same.
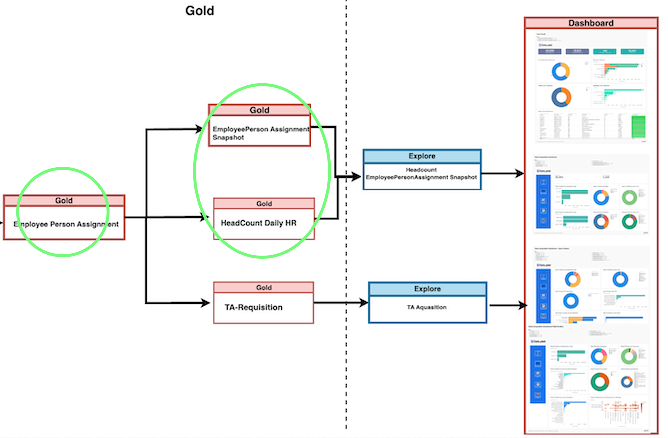
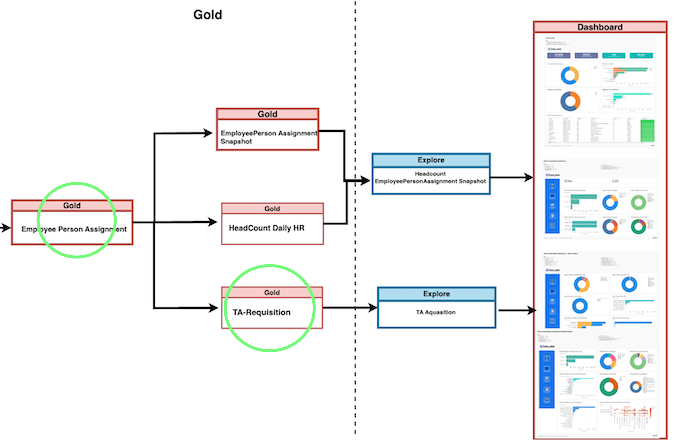
7. People Analytics – Data Models

Within People Analytics, three distinct data models have been established to meet specific business needs.
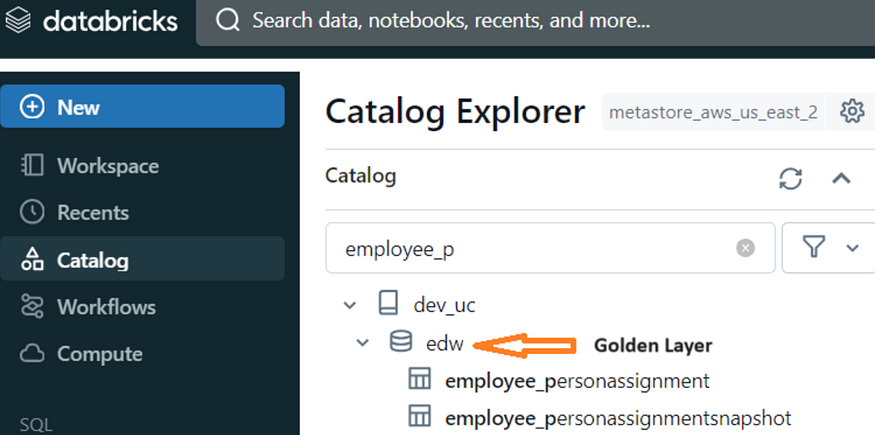
1. Employee Person assignment Snapshot
2. Headcount Daily HR
3. Talent Acquisition
These models serve as the foundation for generating Omni reports. Primary tables sourced from OracleEBS serve as the core components of these models, complemented by dimension tables encompassing Location, Country, Timezone, and Client Information. It’s worth noting that all dimensions are shared across these models.
7.1 Deep Dive into Headcount Data Models
At the heart of this Model lies the Employee-PersonAssignment table, functioning as the primary fact table. The OracleEbs tables serve as the main source for populating the Employee-PersonAssignment table. Additionally, dimension tables associated with Clients and Employees are incorporated and joined to augment the data within the Employee-PersonAssignment table. Furthermore, Learnpoint related tables are seamlessly integrated to capture pertinent information.
7.1.1 Headcount Overview — Omni Dashboard & KPIs
Your employee headcount report obviously needs to include the exact number of employees that are currently working for you. But there are other aspects of your workforce that you need to include, aside from this quantitative data. That way, your report will also highlight data relating to demographic and qualitative data, too.
Headcount data usually includes information relating to:
Headcount
Total Number of Employees in an Organization. This information is Key in an Organization.
Gender Headcount distribution
The number of males, females and other intersex variations Employees in an Organization. From the standpoint of diversity, this could be an important factor for some target groups.
Employment Type Distribution
The Number of Employees who worked on different Employment Types (Full Time, Part Time, Contract). These numbers can provide you with information on the flexibility you might have in target groups with upscaling or downscaling FTEs .
Age category distribution
The Number of Employees who fell under a certain age. This gives a detailed distribution of age within the target group and might indicate a lack or surplus of senior people. The latter could indicate a risk of a large chunk reaching retirement age and capacity and knowledge leaving the organization.
Country Distribution
Number of the workforce employees from Different Countries
Job Family
A job family is a grouping or classification of related job positions within an organization that share similar characteristics, skills, responsibilities, and career paths.Job families are used to categorize and organize various roles in a systematic way, making it easier for an organization to manage its workforce, establish compensation structures, and plan for career development and progress.
7.2 Deep Dive into Talent Acquisition Data Model
At the heart of this module is the Employee-PersonAssignment table, acting as the primary fact repository. Taleo tables are consolidated with the Employee-PersonAssignment table to form the Talent Acquisition Fact table. Additionally, Taleo Related Silver layer tables are utilized to gather Taleo information. Alongside OracleEbs tables, dimension tables concerning Clients and Employees are joined to enhance the data within the Employee-PersonAssignment table.
7.2.1 Talent Acquisition — Omni Dashboard & KPIs
Talent Acquisition Overview Dashboard
Talent Acquisition -Open Position
Talent Acquisition — Filled Position
Open Positions
An opening Position is a specific vacancy where your organization wants to hire an individual
Filled Positions
A candidate (or candidates) was selected and all positions for the job requisition have been filled. Status Closed. Meaning The recruiting effort was canceled, and the job requisition can no longer be filled.
Time to Hire
Time to hire measures the time between a candidate applying for a job and accepting a job. This is one way to evaluate the effectiveness of the hiring process. Faster, more efficient hiring processes tend to draw in higher-quality candidates, resulting in a better outcome for both companies and candidates.
Time to Fill
Time to fill differs from time to hire in that it measures how long a role remains open. If your time to fill is consistently higher than average, then there may be a gap in the recruitment process. Often, when time to fill is long, it indicates issues within your recruitment strategy like bottlenecks or inefficient manual processes. These issues take valuable time away from your human resources teams and hiring departments and slow down the hiring process, leading to fewer hires and a longer fill time.
Avg Budget / Position
The Average Budget to allocate to fill each Requisitions in a company.
Open/Filled Position by Job Level
This shows the number of Positions are Opened or Filled in recent times by Job Level.
Open/Filled Position by Gender
This shows the number of Positions are Opened or Filled in recent times by JobLevel.
Applicants by Country
Number of Applicants for each job Requisitions by Country.
8. Conclusion
Our implementation of HR analytics on Databricks with AWS represents a commitment to harnessing the power of data for strategic advantage. By leveraging Databricks’s robust infrastructure, we empower businesses to make informed decisions, mitigate risks, and drive sustainable growth in an ever-evolving market landscape.
9. How Data platr can help?
Data platr specializes in delivering cutting-edge solutions in the realm of People Analytics with a focus on leveraging the power of Databricks. Through our expertise, we provide comprehensive analytics solutions tailored to optimize Headcount, Retention, Compensation, Talent Acquisition analysis and more. By harnessing the capabilities of cloud, we offer a robust framework for implementing advanced analytics tools, allowing businesses to gain actionable insights and make data driven decisions.
Curious And Would Like To Hear More About This Article?
Contact us at info@dataplatr.com or Book time with me to organize a 100%-free, no-obligation call