Modernize On-Prem Oracle Business Intelligence GL( OBIEE/OBIA ) with Google Cloud BigQuery & Looker — Part 2
This article serves as a continuation of Part 1, focusing on the technical aspects of General Ledger KPIs and Dashboards. For a comprehensive understanding of the General Ledger module, we recommend reviewing Part 1 first.
Table of Content
1. Why Modernize Legacy On-Prem Oracle BI Application
- Oracle Support for OBIEE/OBIA is phasing out and your Organization needs a new home for Analytics.
- Cloud data warehouses provide elastic scalability, allowing organizations to easily scale their computing and storage resources up or down based on demand
- Leading cloud providers invest heavily in security measures to protect customer data, including robust encryption, access controls, and compliance certifications.
- Opens up opportunities for Advanced Analytics like ML / AI / LLM
- Cloud Data platforms enables Integration with Source Systems ( ERP, CRM, HCM, Planning, WMS, & Marketing ) for 360 view of Analytics.
- Cloud data warehouses are built on modern distributed architectures designed to deliver high performance for data processing and analytics workloads.
- Cloud data warehouses offer greater flexibility compared to traditional on-premises solutions.
2. Modernize Oracle BI with Cloud Data Architecture
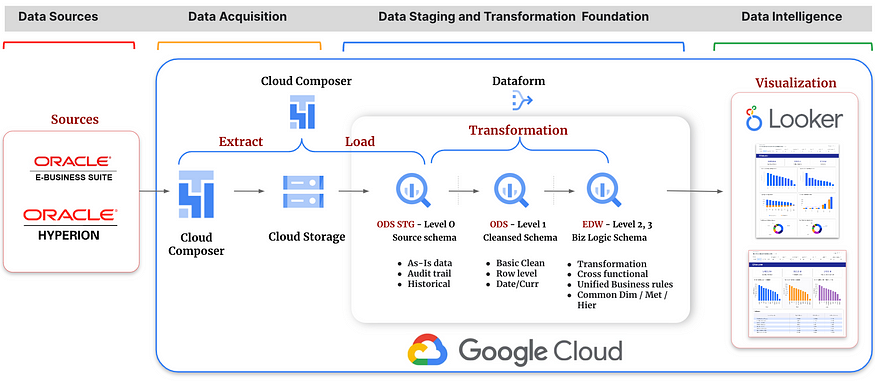
2.1 — Data Extraction & Load via Cloud Composer:
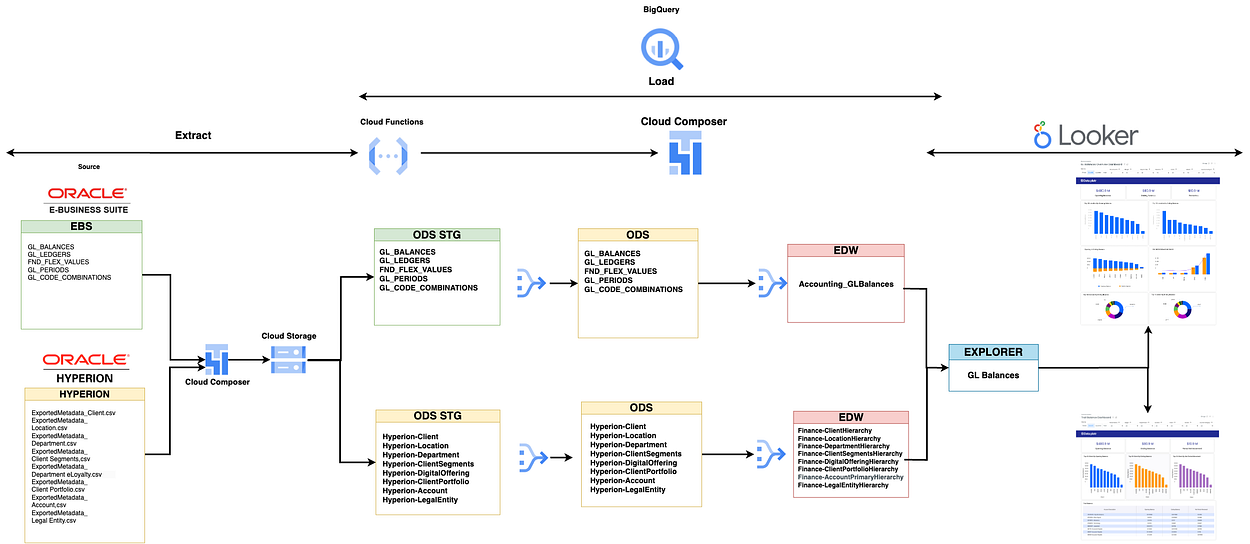
Data from the source system (Oracle EBS GL Module) is ingested into ODS Stage schema through cloud composer application, the oracle EBS data is first landed into GCS bucket in CSV format and then inserted into the ODS STG schema. After the initial load, the data from Oracle EBS is pulled incrementally into the GCS bucket.
Then the data is ingested into the ODS Schema. This merging of data from ODS Stage to ODS Schema of BigQuery is implemented in the cloud composer itself.
Sample Tables Extracted form Oracle EBS,
GL_BALANCES
GL_LEDGERS
FND_FLEX_VALUES
GL_PERIODS
GL_CODE_COMBINATIONS
Once the data is merged from ODS stage schema to ODS schema, the oracle EBS data file that was created in the GCS bucket is moved to an archived location within the GCS bucket.
2.2 — Change Data Capture ( CDC ) via Cloud Composer
This is done by using a system variable that maintains that last successful execution start date of cloud composer code. Only those records are processed from EBS that have last_update_date as greater than or equal to this date.
Additionally cloud composer is empowered with an option to pass prune days as well which is leveraged here to go one day back further from last successful execution start date of cloud composer code to get the recently modified data in source. This ensures that there is an extra cushion to ensure that the code is missing any of the records that are modified in source.
The config file shown in the diagram maintains the information such as project id, region, gcs bucket information, initial extract date, repository etc.
2.3 — Data Transformation via Dataform
From ODS layer to EDW the data mart is cleansed and transformed according to the business requirement through the Dataform in Google Cloud Platform.
The Dataform Scripts are executed on a daily basis to get the most recent data from the source.
This execution of the Dataform jobs is automated using the Cloud Composer. To do this each Dataform job is given a tag name and the cloud composer is able to execute those jobs via these tag names.
In the transformation the data is denormalized as per the data model defined below. All the needed naming standards and conventions are followed while creating data models.
2.4 — Visualization
Looker is connected to the EDW Schema for all the reporting needs.
3. General Ledger Data Models

In the GL module we have created 2 data models based on the business requirement.
- GL Balances
- GL Journals
The final looker reports generated are based on these 2 models. All the dimensions are shared across these models.
Some unique feature of these models include
- Dynamic currency conversion based on the type of account such as a balance sheet or income statement.
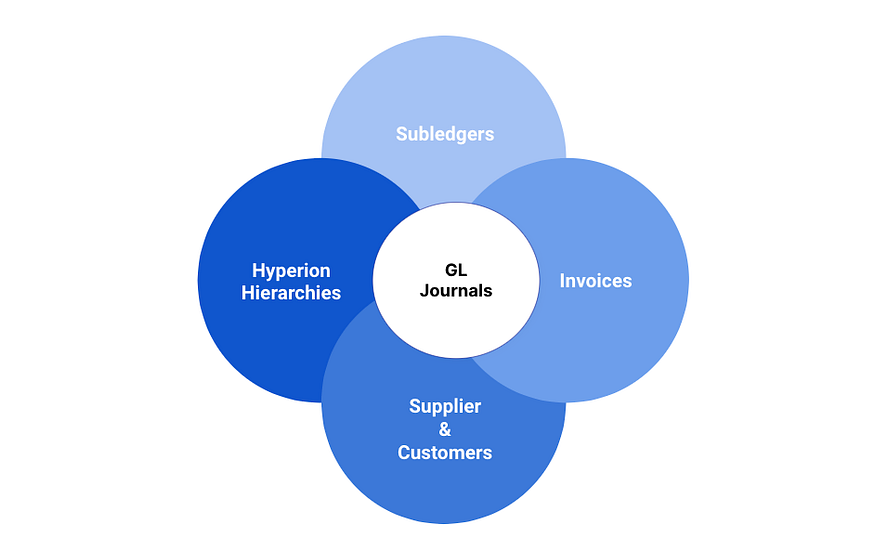
- Integration of journal data with other modules such AP and AR to get invoice, supplier and customer information. This enables account reconciliation between general ledger and subledger.
- Integration of GL balances data with account hierarchy from hyperion allows creation of critical financial reports such as income statements and balance sheets.
- Drill through from General ledger to Subledger.
- The dimension tables will include the accounting information and their associated hierarchies, Ledger, Period, supplier and customer information.
- Except for supplier and customer all other dimensions are common across both the models and are joined with the fact tables to get the desired information.
- Both the models are integrated with the hierarchies that are defined in hyperion to get the hierarchies related to account, department, company and other segments.
- Additionally in both the data model currency conversion mechanism is applied to convert the transaction recorded in local currency to global currency like USD.
4. Deep Dive Into GL Journal Data Model
4.1 GL Journal Dataflow
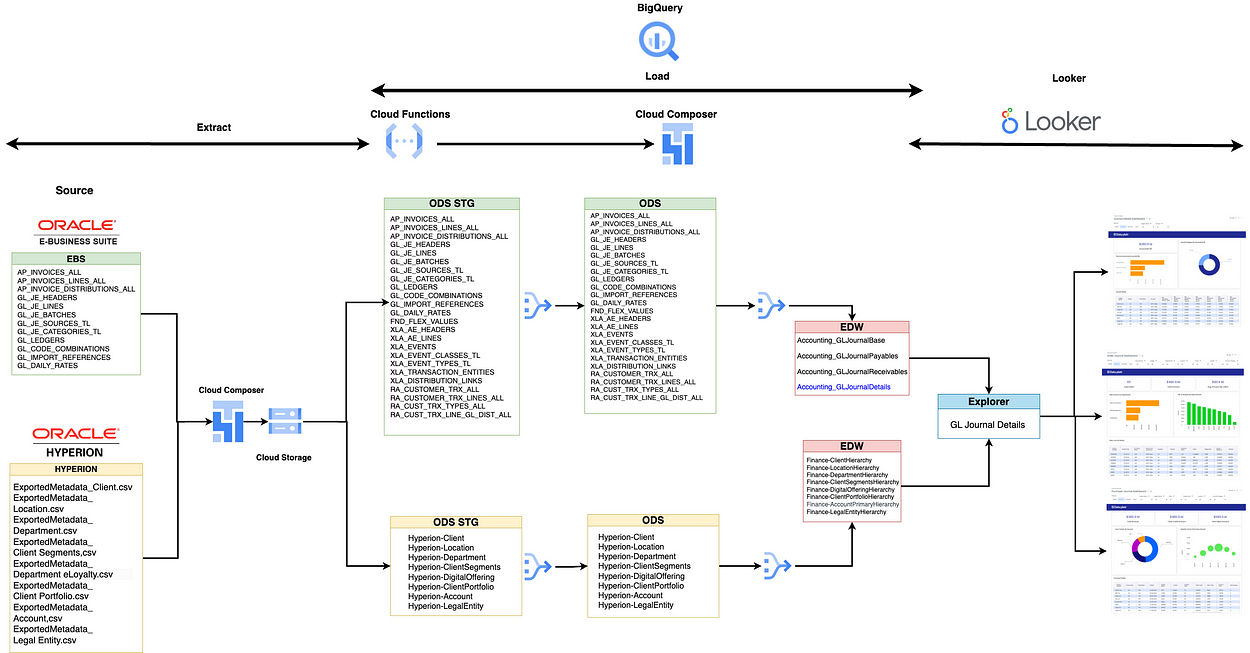
Based on the above figure, Data flows from EBS and Hyperion to the GCP ecosystem. Source data is first dropped into a GCS bucket in csv file format using the cloud composer. Various one to one target tables are created that hold the EBS table data in bigquery tables. This stage of data flow is called data replication. All the target tables related to GL are listed above in the Data flow diagram. Once the data replication is done in the ODS layer the final Edw tables are created by performing the desired transformations. This is done using the dataform. Finally this transformed data is consumed by Looker to produce the desired reports and actionable insights.
The granularity of the model is set at Journal Line Level. However the granularity is extended to Invoice Distribution level for purchase and sales journals. The accounting related details are obtained by joining with the GL Code Combination table.
The audit columns are added at the denormalized level and the naming standards are followed.

The model provides detailed journal information at the supplier, customer, and invoice levels, offering unparalleled insights and facilitating robust account reconciliation processes between the General Ledger and Subledger Modules. Establishes a robust audit trail, facilitating traceability and accountability for each financial entry.
The model deploys a dynamic currency conversion methodology that converts the accounted credit and debit into global currency based on the account type. For Income Statement related accounts are used monthly average of conversion rates while for Balance Sheet accounts it uses month end rate.
The model is extended to integrate the data flowing from EBS with Hyperion hierarchies related to each of the segments.
Time-series KPIs such as year-to-date, quarter-to-date are pre calculated in the model.
Net Amount is calculated in the model as difference between debit and credit and is available in transaction currency, ledger currency and global currency (example USD)
4.2 Dashboards and Visualizations for GL Journals
4.2.1 GL Journal Details Dashboard
The Integrated GL Journals Details Dashboard stands out as a powerful tool offering a nuanced exploration of journal entries, uniquely providing insights at the levels of suppliers, customers, and invoices. This dashboard goes beyond traditional GL views, integrating seamlessly with Accounts Payable (AP) and Accounts Receivable (AR) to enhance visibility and facilitate robust account reconciliation between the General Ledger (GL) and SubLedger modules.
Key Features GL Journal Details Dashboard:
Journal Entry Details:
- Transaction Specifics: Presents comprehensive details for each journal entry, including transaction descriptions, dates, and amounts.
- Audit Trail: Establishes a transparent audit trail for accountability and traceability.
Integration with AP and AR:
- Accounts Payable (AP): Supplier-Centric View: Provides insights into journals associated with suppliers, fostering a clear understanding of payables and vendor relationships. Invoice-Level Breakdown: Allows detailed analysis of journal entries linked to individual invoices in the AP module.
- Accounts Receivable (AR): Customer-Focused Reporting: Enables detailed exploration of journals associated with customers, enhancing visibility into receivables and customer relationships. Invoice-Level Analysis: Offers a granular breakdown of journal entries related to specific customer invoices in the AR module.
- Facilitates Account Reconciliation: GL and Subledger Alignment: The integration with AP and AR modules supports seamless account reconciliation, ensuring consistency between the GL and subledger data.
Benefits:
- Detailed Financial Transparency: Journals can be analyzed at the levels of suppliers, customers, and invoices, providing a nuanced view of financial transactions for improved transparency.
- Efficient Reconciliation Process: Integration with AP and AR streamlines the account reconciliation process, minimizing discrepancies between the GL and subledger.
- Informed Decision-Making: Enhanced visibility into journal entries at various levels empowers stakeholders with timely and relevant financial information for strategic decision-making.
- Operational Efficiency: Automation of journal entries and integration with subledger modules reduces manual efforts, improving operational efficiency and reducing the risk of errors.
The Integrated GL Journals Details Dashboard serves as a comprehensive solution, allowing detailed exploration of journal entries and promoting transparency at the levels of suppliers, customers, and invoices. By integrating with AP and AR, it not only enhances financial visibility but also streamlines the account reconciliation process, ensuring accurate and efficient financial management.
4.2.2 Sales Journal Dashboard
The Sales Journal Dashboard is a specialized tool tailored for in-depth insights into sales transactions, with a customer-centric focus. This dashboard provides a comprehensive analysis of the sales journal, emphasizing customer details and associated invoices.
Key Features of Sales Journal Dashboard:
- Customer-Centric Metrics: Sales Transactions by Customer: Presents a detailed breakdown of sales transactions, offering insights into customer-specific performance. Invoice-Level Analysis: Allows users to explore associated invoices for each customer, facilitating a granular understanding of sales activities.
- Detailed Sales Analysis: Transaction Breakdown: Provides comprehensive metrics for each sales transaction, including transaction dates, amounts, and descriptions. Historical Performance: Enables users to track the historical sales performance of individual customers.
- Strategic Decision Support: Top Customers: Highlights the top-performing customers based on sales transactions, aiding in strategic decision-making and customer relationship management.
- User-Friendly Interface: Intuitive design ensures easy navigation, allowing users to quickly access and analyze sales data.
Benefits:
The Sales Journal Dashboard empowers users with customer-centric insights into sales transactions, facilitating strategic decision-making and enhancing customer relationship management. Its user-friendly interface and detailed metrics make it an invaluable tool for businesses seeking a comprehensive view of their sales activities.
4.2.3 Purchase Journal Dashboard
The Purchase Journal Dashboard is a dedicated platform providing detailed insights into purchasing activities, with a primary focus on suppliers and associated invoices. This dashboard enables users to comprehensively explore the purchase journal, gaining valuable insights into supplier relationships and transaction details.
Key Features Purchase Journal Dashboard:
- Supplier-Centric Metrics: Purchase Transactions by Supplier: Offers a detailed breakdown of purchasing transactions, providing insights into supplier-specific performance. Invoice-Level Exploration: Allows users to delve into associated invoices for each supplier, facilitating a granular understanding of procurement activities.
- Comprehensive Purchase Analysis: Transaction Details: Presents detailed metrics for each purchase transaction, including transaction dates, amounts, and descriptions. Historical Purchasing Trends: Enables users to track historical purchasing trends with individual suppliers.
- Strategic Decision Support: Top Suppliers: Highlights the top-performing suppliers based on purchasing transactions, aiding in strategic decision-making and supplier management.
- User-Friendly Interface: Intuitive design ensures easy navigation, allowing users to quickly access and analyze purchase data.
Benefits:
The Purchase Journal Dashboard serves as a valuable tool for businesses seeking supplier-focused insights into purchasing transactions. With its user-friendly interface and comprehensive metrics, this dashboard enhances strategic decision-making and supplier relationship management, providing a holistic view of procurement activities.
5. Deep Dive Into GL Balances Data Model
5.1 GL Balances Dataflow
Data flows from EBS and Hyperion to the GCP ecosystem. Source data is first dropped into a GCS bucket in csv file format using the cloud composer. Various one to one target tables are created that hold the EBS table data in bigquery tables. This stage of data flow is called data replication. All the target tables related to GL are listed above in the Data flow diagram. Once the data replication is done in the ODS layer the final Edw tables are created by performing the desired transformations. This is done using the dataform. Finally this transformed data is consumed by Looker to produce the desired reports and actionable insights.
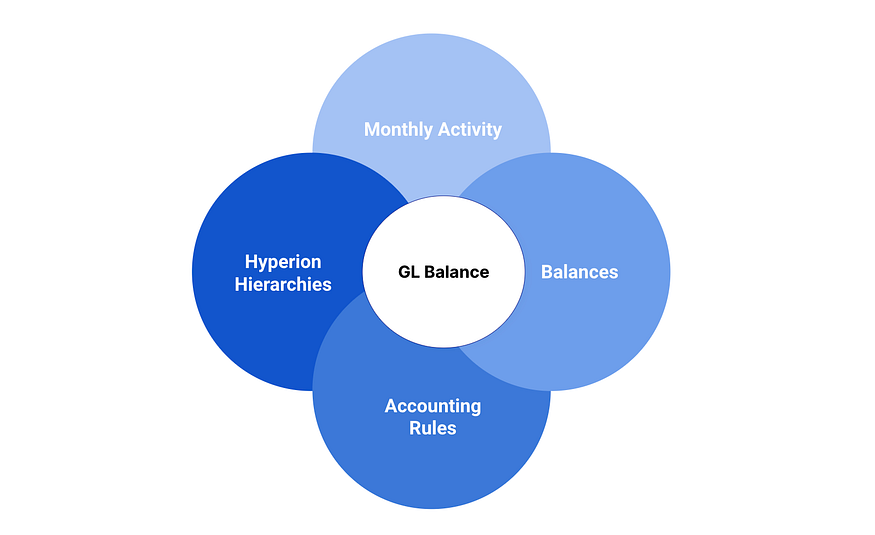
The GL Balances presents summarized as well as detailed view of the General Ledger accounting by capturing both the monthly activity as well as balance amount details. EBS tables related to GL balances is the primary table for this model along with other supporting tables.
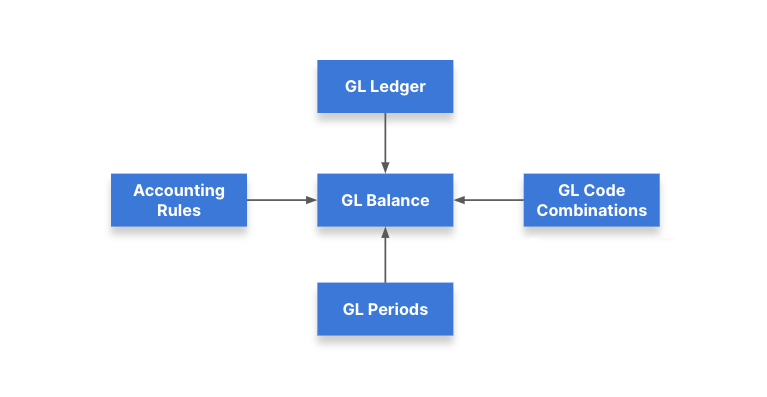
For the combined aggregate the granularity of the data is kept at a GL Code Combination level. The accounting related details are obtained by joining the table with the GL Code Combination table.
Time-series KPIs such as year-to-date, quarter-to-date are pre calculated in the model. Pre-calculated KPIs related to opening and end balances in terms of transaction, ledger and global currency are added in the model.
The developed data model seamlessly integrates GL Balances date with the Account Hierarchy provided by Hyperion. This integration creates a powerful and dynamic foundation for generating accurate and insightful financial reports, including balance sheets and income statements.
The model is extended to integrate the data flowing from EBS with Hyperion hierarchies related to each of the segments.
5.2 Dashboards and Visualizations for GL Balances
5.2.1 GL Balances Dashboard
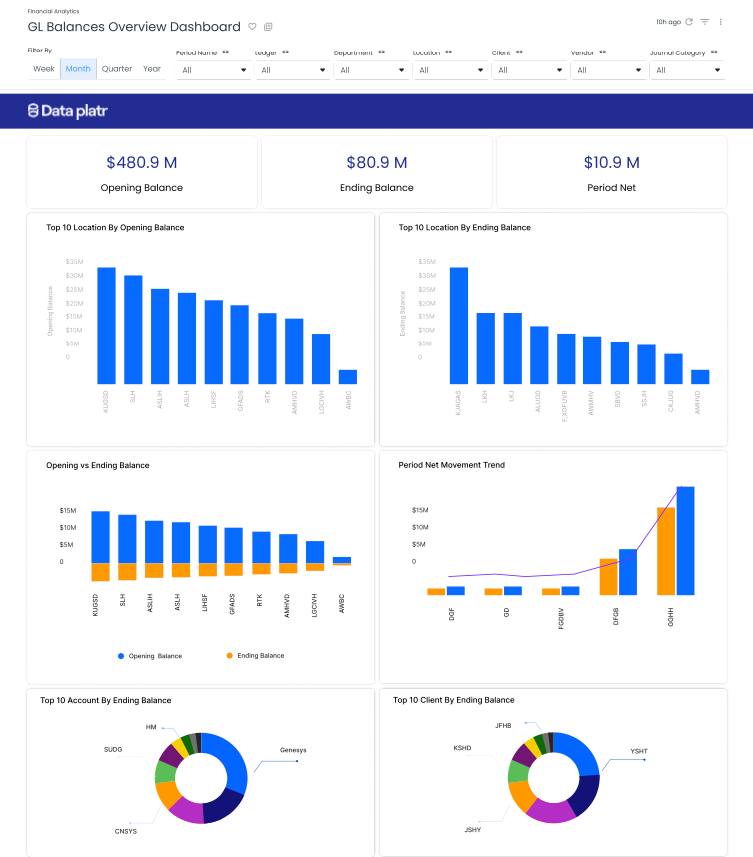
The dashboard provides a snapshot of financial data for a given fiscal period, offering key insights into the opening balance, period net movement, and ending balance.This dynamic dashboard allows users to analyze data at both the segment and hyperion hierarchy levels, promoting in-depth financial understanding and strategic decision-making.
Key Features of the GL Balances Dashboard:
Summary Metrics:
- Opening Balance: Displays the initial financial position at the beginning of the fiscal period.
- Period Net Movement: Illustrates the net changes that occurred during the specified period.
- Ending Balance: Highlights the concluding financial position at the end of the fiscal period.
Slicing and Dicing:
- Segment Level: Users can analyze data by segment, gaining insights into specific business divisions or units.
- Hyperion Hierarchy Level: Allows for a hierarchical breakdown, aligning with the organization’s financial structure.
Drill-Down Analysis:
- Double-Click Functionality: Reports on the dashboard can be double-clicked to initiate a detailed analysis at the account level, providing a granular understanding of financial activities.
Benefits:
- Holistic Financial Overview: The dashboard provides a comprehensive view of the fiscal period, enabling stakeholders to grasp the financial landscape at a glance.
- Flexible Data Exploration: Users can slice and dice data based on segments or navigate through the Hyperion hierarchy, tailoring the analysis to specific organizational needs.
- Efficient Decision-Making: Quick access to opening balances, net movements, and ending balances empowers decision-makers with timely and relevant financial information.
- Detailed Account Analysis: The ability to drill down to the account level ensures a thorough investigation of financial details for precise decision-making and strategic planning.
This comprehensive dashboard offers a powerful tool for financial analysis, combining high-level summaries with the flexibility to explore data at different levels. With its intuitive design and detailed functionality, this dashboard enhances financial transparency and supports informed decision-making within the organization.
6. Conclusion
In this article, we have highlighted the intricacies of general ledger (GL) architecture, data flow, and data models, shedding light on how organizations can leverage advanced technologies to streamline financial processes and gain valuable insights.
The unique features and capabilities of our GL Journal model, which integrates the General Ledger with Subledger systems such as Accounts Payable (AP) and Accounts Receivable (AR). This integration allows for a seamless flow of information, enabling detailed analysis at the invoice level and providing end-to-end visibility under one comprehensive umbrella. The ability to drill through from a Journal entry all the way down to individual invoices sets our model apart, offering unparalleled transparency and granularity in financial data.
Furthermore, we have implemented a dynamic currency conversion mechanism that automatically converts transaction amounts into a global currency (example USD) based on the account type, whether it be income statement or balance sheet accounts. This feature enhances international financial reporting and ensures consistency across diverse financial operations.
In addition, our GL Balances model captures both monthly actuals or activity amounts and balance amounts, supporting critical reporting requirements such as income statements, balance sheets, and trial balances. The integration with Hyperion hierarchies further enriches our models, providing users with a comprehensive view of financial information aligned with organizational structures.
As organizations navigate the complexities of modern finance, our innovative GL solutions offer a robust foundation for informed decision-making, strategic planning, and regulatory compliance. By harnessing the power of GCP and data integration, we empower financial professionals to unlock actionable insights and drive sustainable growth in today’s dynamic business landscape.
How Data platr can help?
Data platr specializes in delivering cutting-edge solutions in the realm of financial Analytics with a focus on leveraging the power of Google Cloud Platform (GCP) / Snowflake / AWS. Through our expertise, we provide comprehensive analytics solutions tailored to optimize general ledger analysis and reconciliation. By harnessing the capabilities of cloud, we offer a robust framework for implementing advanced analytics tools, allowing businesses to gain actionable insights and make data driven decisions.
Curious And Would Like To Hear More About This Article?
Contact us at info@dataplatr.com or Book time with me to organize a 100%-free, no-obligation call