Contact Center Analytics — Unlock Agents Call Handling KPIs and Dashboard — Part 3

Why Agent Analytics in Contact Center?
From earlier we have understood what a Contact Center and a few of very important KPIs that help determine its operational aspects. The KPIs discussed so far were at the overall granularity. Agents are the key players in keeping the Operations of a Contact Center do warrant observations, their daily task efficiency tracking, calls handling metrics etc.
Agent level KPIs are important to gauge, at individual Project — Teams — Agents level, the daily workings of the Contact Center. For business even at the ground level i.e. the Leads of the teams within the many projects, how their fellow Agents are performing, make for an important input in managing the outcomes and issue tracking/resolutions. These KPIs need to be well understood, documented and presented in a succinct Dashboard for quick consumption and actionable insights.
If you haven’t had the chance to explore Part 1 and Part 2 of our article, we encourage you to start there for essential insights before delving into this chapter
Deep Dive into Agents — Calls Details KPIs and Dashboard:
Below we discussed some of the many important KPIs, their technical understandings, business relevance and sample visualizations.
Agent Availability %:
If a contact center wants to assess how many agents are available and waiting to speak to customers on average, they would measure their agent availability. In other words, this metric looks at the percentage of time that agents are available and ready to take calls during their shift. It calculates the efficiency and utilization of an agent’s time for engaging with customers
Calls per Hour (CPH):
Calls per Hour measures the Contact center agent’s productivity based on the average number of calls that the Contact center agent receives per hour. However, it also takes the agent’s wait time into account. Wait time refers to the period when the agent is waiting for a call to come. Formula for example: (calls handled) ÷ (login time — wait time) = Calls per Hour.
Working Hours:
Working hours is the total hours an Agent has logged in for their shift marking as working. This hour though simple in definition, it determines the total Agent engagement for the filtered period. Working hours are made up of Active, On-Call, Break etc. sub-categories. This helps business understand the overall time spent by the Agents at work.
Handled Calls:
Handled calls is a term used at call centers to stipulate the number of inbound calls answered or handled by a call center agent without being blocked or abandoned by the agent or the system. It is one of the important metrics used at a call center to evaluate the performance of a call center agent as it points directly towards their efficiency and ability to handle calls assigned to them. Call handling data is collected for both inbound and outbound calls.
Contact Center Analytics: Call Details KPI Dashboard
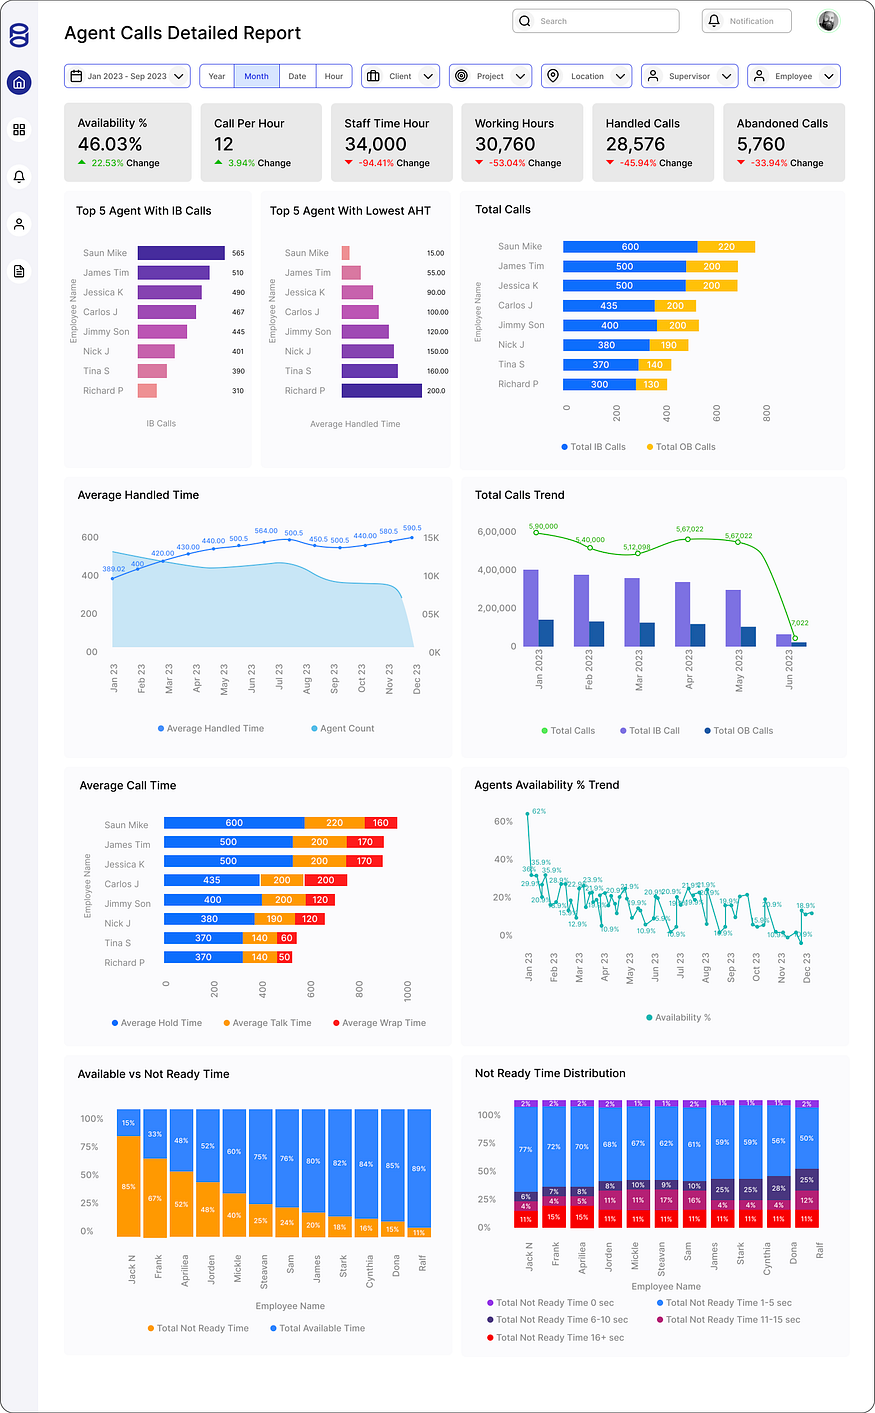
Top 5 Agents with IB Calls:
This tile identifies the top-performing agents based on the number of inbound (IB) calls they handle. It highlights agents who manage the highest volume of incoming calls, showcasing their efficiency in managing call traffic and engaging with customers.
Top 5 Agents with Lowest AHT:
Lowest Average Handle Time (AHT) metric recognizes agents with the shortest average duration of handling calls. A lower AHT generally indicates effective and efficient handling of customer queries or issues, contributing to quicker problem resolution and higher customer satisfaction.
Total Calls Trend:
Total Calls Trend tile represents the historical pattern or trend in the number of calls handled by each agent over a specified period. It illustrates variations, spikes, or consistency in call volumes, aiding in resource allocation and identifying productivity patterns.
Call Time Average:
Call Time Average tile indicates the average duration of calls handled by each agent. It provides insights into the typical length of interactions an agent has with customers, facilitating performance analysis and training needs.
Available vs. Not Ready Time:
This tile contrasts the time an agent is available and ready to take calls versus the time spent in a state of unavailability (e.g., in after-call work, on break, or marked as not ready). It helps evaluate an agent’s readiness and adherence to being available for incoming calls.
Not Ready Time Distribution:
Not Ready Time Distribution of an Agent measures the time lapsed when they could not take up calls during their working hours. This can be due to idle state, time gap between two calls or customer interactions, or even the time spent by agents in operational work and not customer interaction handling. This determines the time lost and can be tied to Abandonment rates.
Conclusion:
Each of the above metrics, helps get an insight into the Agents daily activities, engagements, efficiencies and gaps in better utilization towards higher operational outputs and customer satisfaction. Complementing KPI understanding with the right Visualization helps business understand more details and determine the right actionable steps to mitigate issues.
How Data platr can help ?
Dataplatr specializes in delivering cutting-edge solutions in the realm of Contact Center Analytics with a focus on leveraging the power of Google Cloud Platform (GCP) / Snowflake / AWS. Through our expertise, we provide comprehensive analytics solutions tailored to optimize contact center operations and enhance customer experiences. By harnessing the capabilities of Cloud, we offer a robust framework for implementing advanced analytics tools, allowing businesses to gain deep insights into call details, agent performance, and overall productivity.
Curious And Would Like To Hear More About This Article ?
Contact us at info@dataplatr.com or Book time with me to organize a 100%-free, no-obligation call
Follow us on LinkedIn for more interesting updates!