Introduction
In modern data-driven organizations, the biggest challenge is not just storing or processing data but making it accessible and simple for business users. Executives and managers want tools that are user-friendly, intuitive, and easy to drill down into for deeper insights with just a few clicks, without relying on technical teams. Cloud BI platforms like Sigma Computing address this need by combining the scalability of cloud data warehouses such as Snowflake, BigQuery, Redshift, and Databricks with a spreadsheet-like interface that feels familiar to business people. At the core of Sigma is the Sigma data Model, a semantic layer that centralizes business logic, enforces governance, and ensures consistent KPIs across teams. This means business users get self-service analytics they can trust, while organizations benefit from consistency, scalability, and cross-functional alignment.
What is a Sigma Model?
A Sigma Model is a semantic layer that sits on top of warehouse data. It abstracts raw schemas into a business-friendly layer that contains:
- Reusable Metrics and KPIs (e.g., ARR, Customer Churn, Gross Margin)
- Relationships and Joins between fact and dimension tables
- Calculated Fields for business-specific transformations
- Governance Controls such as field exposure, masking, and row-level security

Sigma Data Model Features and How They Empower Business Teams
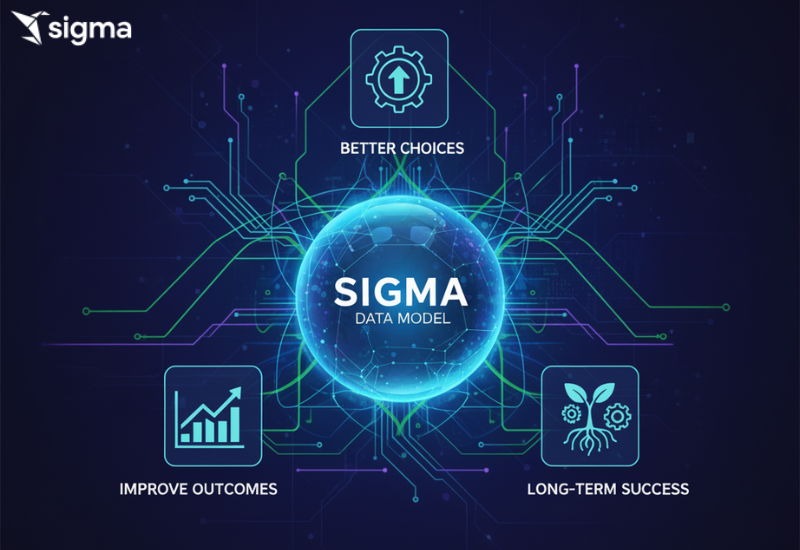
The Sigma Data Model is not just a technical tool—it’s a strategic asset for business teams. It creates a governed layer on top of raw datasets, translating complex data into business-friendly views, metrics, and definitions. This ensures every team—from Finance to Sales to Operations—can work with trusted, consistent, and actionable insights.
- Columns & Calculated Fields - In Sigma Models serve as the foundation for turning raw data into meaningful business insights. Instead of exposing users to confusing technical field names like cust_id or rev_amt, models allow these columns to be renamed into clear, business-friendly terms such as Customer ID or Revenue Amount. Beyond renaming, calculated fields enable the creation of new values by applying reusable logic—for example, Profit = Revenue – Cost or Cycle Time = End Date – Start Date. This ensures that all teams work with the same trusted definitions rather than creating their own formulas in spreadsheets or dashboards. By centralizing transformations in the model, organizations reduce dependency on IT, minimize errors from inconsistent calculations, and speed up reporting. Ultimately, this feature empowers business users to work confidently with data they can understand, while analysts ensure that logic is standardized, governed, and scalable across the company.
- Relationships - In Sigma Models define how different tables connect with each other—such as linking Customers → Orders → Products—so users can seamlessly analyze data across multiple sources without needing to manually write SQL joins. By mapping these connections once at the model level, Sigma data model ensures that data joins are consistent, accurate, and reusable in every report or dashboard. This eliminates the risk of errors from ad-hoc or incorrect joins, reduces duplication of effort, and provides business teams with a holistic view of operations across departments. With relationships in place, a user can start at a high-level metric like total revenue and drill down into customer-level or product-level details, all while relying on the same governed logic. This feature not only improves accuracy but also enables cross-functional insights, helping teams move from isolated analysis to connected, enterprise-wide decision-making.

- Metrics - In Sigma Models provide standardized, reusable definitions for key business KPIs such as Revenue, Cycle Time, or Gross Margin. Instead of each team building their own version of these calculations, metrics are defined once in the model and automatically applied consistently across all dashboards, reports, and analyses. This creates a single source of truth, ensuring that Finance, Sales, Operations, and other departments all work with the same trusted numbers. By eliminating conflicting definitions, metrics reduce confusion and debates about “whose number is correct” and allow leaders to focus on making decisions rather than reconciling reports. Centralizing KPIs also speeds up analysis, since users don’t have to recreate formulas, and improves governance by embedding business-approved logic at the model layer. In short, metrics align the entire organization on consistent performance measures, enabling faster and more confident decision-making.

- Documentation & Descriptions - In Sigma Models add plain-language context to every field, metric, and piece of business logic so users don’t have to guess what the data represents or how it should be used. Instead of exposing teams to cryptic database terms or leaving calculations unexplained, descriptions provide clarity—such as clarifying whether Churn Rate is monthly or annual, or whether Revenue includes discounts. By embedding this information directly into the model, business users can confidently explore data on their own without needing to constantly consult analysts or IT. This improves self-service analytics, reduces back-and-forth between teams, and accelerates onboarding for new users who can quickly understand how data is structured and defined. Ultimately, documentation transforms the Sigma data Model into not just a governed data layer but also a living knowledge base that makes analytics more accessible, transparent, and business-friendly.
- Filters & Data Policies - In Sigma Models apply predefined rules that control how data is displayed and who can access it, ensuring that users see only the most relevant and governed information. Filters make reporting simpler by automatically narrowing data to meaningful slices, such as showing only the current quarter or active projects, so business users don’t have to set up complex conditions manually. Data policies add an extra layer of governance, allowing organizations to enforce rules like row-level security (e.g., a regional manager only sees their region’s data while executives can view company-wide performance). Together, these capabilities reduce manual effort, prevent errors, and ensure compliance with privacy and regulatory requirements. By embedding governance into the model itself, filters and data policies empower self-service analytics while keeping control in place, giving business teams confidence that the data they use is accurate, relevant, and secure.
- Column Security - In Sigma Models safeguards sensitive information by controlling which users or groups can access specific fields, such as salaries, discounts, or profit margins. Instead of creating separate datasets for different audiences, permissions can be applied directly at the column level, ensuring that confidential data is only visible to authorized teams while the rest of the dataset remains usable for broader analysis. This approach maintains compliance with privacy regulations, reduces the risk of data leaks, and protects business-critical information without slowing down reporting. At the same time, it enables flexibility—Finance may need full visibility into margins, while Operations might only see revenue and costs. By embedding these rules directly into the model, organizations strike the right balance between security and usability, empowering teams to access the insights they need while keeping sensitive data protected and controlled.

Key Benefits for Business Users
- User-Friendly and Intuitive
- Explore dashboards effortlessly, with drag-and-drop, search, and filter features.
- Drill down with one click to get deeper insights.
- Provides visual cues, charts, and KPIs that are easy to understand without technical knowledge.
- Minimizes training time—business users can start analyzing data immediately.
- One Source of Truth Sigma Semantic Layer
- Standardized definitions for revenue, margin, churn, and cycle time.
- Eliminates conflicting reports, reducing confusion and errors.
- Ensures all departments trust the same numbers and reports.
- Helps leadership make confident, data-driven decisions.
- Self-Service Analytics Without Risk
- Users can filter, slice, and explore data independently.
- Built-in governance and permissions prevent accidental misuse of data.
- Reduces reliance on IT for routine ad-hoc queries.
- Enables experimentation while maintaining data integrity.
- Time-to-Insight Acceleration
- Immediate access to KPIs, dashboards, and metrics.
- Pre-built models eliminate repetitive queries and manual calculations.
- Reduces time spent on consolidating and validating reports.
- Supports rapid decision-making and responsiveness to market changes.
5. Cross-Functional Alignment
- Finance, Sales, Operations, and Marketing work from the same trusted model.
- Ensures everyone speaks the same “data language.”
- Facilitates collaborative decision-making and accountability.
- Helps identify inter-departmental dependencies and efficiencies.
6. Scalable and Agile
- KPIs and business rules can evolve without disrupting workflows.
- Single update to the model applies everywhere—no duplicate effort.
- Adapts quickly to business changes, new metrics, or organizational growth.
- Supports enterprise-wide reporting while staying flexible for smaller teams.
7. Actionable Insights at Your Fingertips
- Highlight anomalies, trends, or risks automatically.
- Users can take immediate action based on insights without waiting for analysis.
- Reduces reactive decision-making and empowers proactive strategies.
8. Enhanced Collaboration and Reporting
- Share dashboards and reports easily with teams or executives.
- Annotate and comment directly on dashboards for discussion.
- Keeps everyone aligned on objectives and KPIs.
9. Cost and Resource Efficiency
- Reduces dependency on specialized BI teams for everyday reporting.
- Frees analysts and IT to focus on strategic initiatives.
- Lowers the cost and effort of generating and maintaining multiple reports.
Strategic Value of Sigma Models
- Decision Confidence – Reliable KPIs foster data-driven strategies.
- Productivity Gains – Business teams spend less time reconciling numbers and more time acting on them.
- Cost Reduction – Minimized duplicate work and optimized use of analyst resources.
- Governance & Compliance – Ensures reports meet internal standards and regulatory requirements.
- Data-Driven Culture – Empowers all business functions to engage with analytics.
By enabling governed self-service analytics, Sigma Data model strengthens enterprise BI strategies and support the growth of sigma analytics and computing across teams.
Conclusions
In essence, the Sigma data Modeling elevates data from a technical backend resource to a governed, In essence, the Sigma Data Model elevates data from a technical backend resource to a business-friendly, governed asset that drives strategy. By standardizing metrics, securing sensitive information, and providing clear, contextualized insights, it ensures every user—whether technical or non-technical—can easily explore and trust the data. Its user-friendly, spreadsheet-like interface makes analytics approachable, empowering business teams to drill down, filter, and analyze information in just a few clicks without complexity. Organizations that embrace the Sigma data Model not only increase efficiency and accuracy but also foster a culture where data is trusted, accessible, and easy to use—ultimately fueling sustainable growth, innovation, and long-term competitive advantage.

