In today's dynamic work environment, understanding how time is spent and tasks are progressing is paramount. Traditional time tracking often provides a quantitative overview but falls short in delivering qualitative insights into productivity, engagement, and potential challenges. What if we could move beyond mere punch-in and punch-out data to truly understand the pulse of our workforce through task intelligence and advanced workforce intelligence?
At Dataplatr, we are pioneering a novel approach to workforce intelligence, leveraging the transformative power of Artificial Intelligence, specifically Large Language Models (LLMs), to extract deep, actionable insights from everyday task-level data. This isn't just about reporting; it's about predicting, optimising, and empowering through AI-powered task intelligence.

The Foundation: Beyond Basic Timecards
Imagine a system where your daily time entries, whether from punch-in/punch-out systems or detailed task logs, become a rich source of intelligence. Instead of just knowing when an employee worked, we aim to understand what they worked on, how consistently, and with what impact.
Our internal innovation focuses on integrating and augmenting existing task-level data to create a comprehensive picture. By applying sophisticated AI logic, we transform raw data into a set of powerful workforce KPIs that illuminate various facets of employee and organisational performance through the lens of task intelligence.
Security and Data Privacy
While the AI/LLM engine plays a key role in deriving insights, data security remains central to the design. All task and timecard data is processed within secure, access-controlled environments (e.g., encrypted Google Cloud services). No sensitive or personally identifiable information (PII) is exposed outside the authorised environment. The LLM operates under strict governance, ensuring that employee data used for analysis is anonymised, encrypted in transit and at rest and compliant with organisational privacy policies, helping organisations adopt AI-powered task intelligence without compromising compliance.
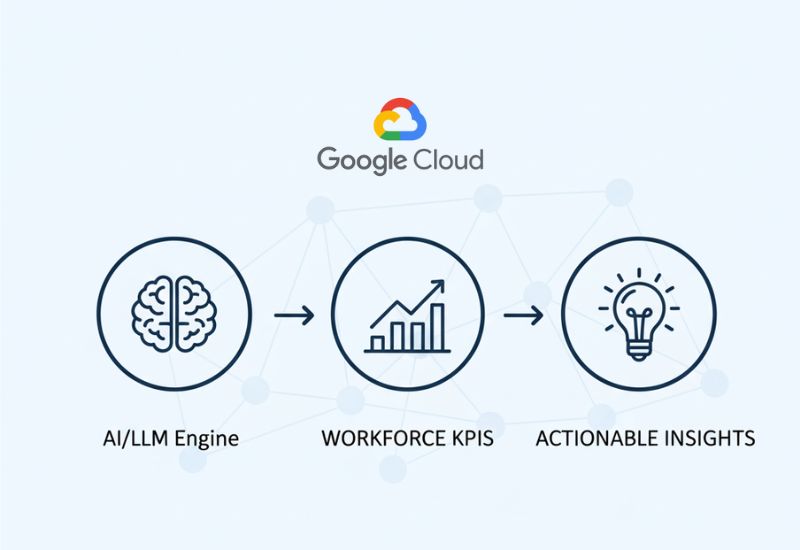
Illustration 1: Data Flow from Raw Entries to Insight. Visualise a flow chart: Raw Time Card Data (Punch-in/out, Task Details) -> AI/LLM Processing Engine -> Extracted workforce KPIs -> Actionable Insights.

The Core: Key Performance Indicators (KPIs) Driving Deeper Understanding
Our system currently focuses on extracting a multi-dimensional view of workforce performance through the following key areas using task intelligence:
1. Submission & Discipline: The Rhythm of Consistency
This KPI set reveals the daily habits and commitment levels of the workforce.
- a. Daily Submission Rate (%): How consistently employees are logging their tasks.
- b. Employees Missing ≥2 Consecutive Days: Identifying early signs of disengagement or potential issues.
- c. Top Consistent Reporters vs. Frequent Defaulters: Benchmarking adherence to reporting protocols.
2. Workload & Bandwidth: Balancing Effort and Capacity
Understanding individual capacity is crucial for preventing burnout and maximising output.
- a. Avg. Daily Logged Hours per Employee: Basic measure of effort.
- b. % of Employees with <8 hrs (Underutilised): Highlighting opportunities for increased contribution.
- c. % with >10 hrs (Overloaded, Burnout Risk): Flagging individuals at risk and prompting intervention.
3. Productivity & Progress: Measuring Impact
Moving beyond just hours, these KPIs focus on actual output and efficiency.
- a. Avg. Tasks Completed per Day: A direct measure of output.
- b. High Performers (Multiple Tasks Completed Daily): Recognising efficient contributors.
- c. Completion-to-Assignment Ratio: Assessing efficiency in meeting assigned goals.
4. Work Variety vs. Repetition: Engagement & Learning
This set uncovers engagement levels and identifies potential areas for skill development or process optimisation.
- a. Task Diversity Ratio (Unique Tasks ÷ Total Tasks): Gauging breadth of work.
- b. Employees with Repetitive Patterns (>70% Same Task): Identifying specialists or, conversely, those in monotonous roles.
- c. Potential "Faking" Signals (Copy-Paste Patterns): Detecting anomalies that might indicate disengagement or superficial reporting.
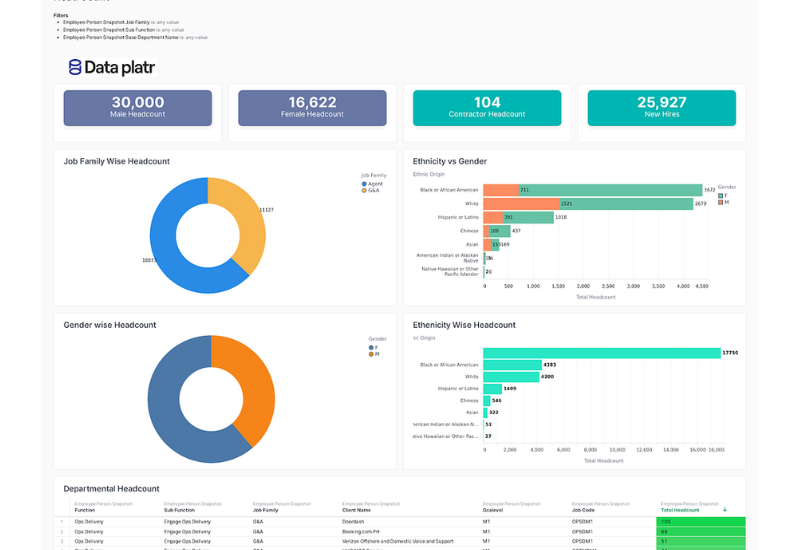
Illustration 2: Example KPI Dashboard (High-Level Snapshot) A mockup of a dashboard showing various workforce KPIs with colour-coded alerts. E.g., a dial for "Daily Submission Rate: 85% (Green)", a bar chart for "Avg. Daily Hours (Team vs. Individual)", a small table for "Top Consistent Reporters".

The LLM Advantage: Generating Actionable Intelligence
The true power of our system lies in feeding these rich KPIs into sophisticated Large Language Models. These LLMs don't just report numbers; they interpret them, identifying patterns and generating comprehensive, narrative-style insights that go beyond what traditional analytics can provide.
Here's how LLMs transform data into truly actionable intelligence:
- Consistency & Discipline Analysis: The LLM analyses overall team consistency in daily submissions, identifying departments or subteams with strong reporting discipline versus those showing irregular patterns. It highlights collective engagement trends and flags teams at risk of low participation or burnout,
- Workload vs. Productivity Synthesis: By correlating average logged hours and task completion rates across the team, the LLM pinpoints areas where workload distribution is unbalanced, such as overworked yet low-output groups or high-efficiency clusters. It also suggests resource reallocation or workflow adjustments to improve team efficiency.
- Engagement & Task Variety Insights: The LLM measures team-level task diversity, spotting repetitive task patterns across members or projects. Low task variety signals potential disengagement or process redundancy, guiding managers to introduce cross-functional exposure or new challenges.
- Comparative Benchmarking: The system benchmarks all teams against organisational averages across workforce KPIs, submission rate, productivity and engagement. It identifies high-performing teams, those requiring support and those maintaining steady performance levels.
- Early Warning & Recommendations: By synthesising aggregated KPI data, the LLM detects emerging risks such as declining productivity trends, missed submissions or overextended workloads. It then generates early alerts and actionable recommendations to managers, ranging from workload balancing to motivational interventions.
- Team Employee Summaries: On demand, the LLM produces a narrative-style summary for each team or project group highlighting collective strengths, improvement areas and strategic suggestions for boosting collaboration and sustained performance..
Illustration 3: Screenshot of an LLM-generated Insight (Example for an employee). Mockup of a text box with an LLM output: "Summary Report for Employee: Jane Doe. Jane exhibits exceptional consistency in daily submissions (98%). Her average logged hours are 8.5, indicating a balanced workload. However, her Task Diversity Ratio of 0.3 suggests a highly repetitive work pattern. Recommendation: Explore opportunities for Jane to cross-skill or take on diverse project tasks to boost engagement and prevent monotony."

Unlocking Organisational & Project-Level Productivity
This system not only provides managers with personalised reports but also grants CTOs and executives an unparalleled Organisational Productivity Dashboard that visualises collective efficiency, resource allocation, and quality trends across all projects and teams, powered by task intelligence and enterprise-wide workforce intelligence.
By gathering additional inputs like Project Phase and granular Task Types, we can introduce powerful new KPIs:
- a. Organisational Throughput Rate: Total tasks completed across Dataplatr per period.
- b. Average Project Velocity: Average tasks completed per day/week across active projects.
- c. Project-Specific COQ/COPQ: Aggregate rework rates and first-time acceptance rates per project.
- d. Time Allocation by Category (Org/Project): Percentage of collective effort spent on "Feature Development" vs. "Training" vs. "Rework," ensuring strategic alignment.
- e. Blocker Impact Index: Quantifying hours lost due to systemic project blockers.
These enable comprehensive visualisations:
- a. Throughput Trend Line: Shows overall organisational output trends over time.
- b. Time Allocation Heatmap (Org-Wide): Visually confirms if collective effort aligns with strategic priorities.
- c. COPQ vs. Throughput Scatter Plot (Org/Team): Identifies high-quality, high-output teams versus those struggling with rework, even if output is high.
- d. Project Progress Burnup Charts: Real-time view of project progress against plans.
- e. Project Quality Breakdown: Pinpoints specific project phases prone to quality issues.
Illustration 4: Screenshot of an Organisational & Project-Level Productivity Dashboard visualises collective efficiency via Throughput Trends and Resource Allocation Heatmaps across the entire company.
Organisational View: Visualises collective efficiency via Throughput Trends and Resource Allocation Heatmaps across the entire company.
Project Health: Tracks Project Velocity and COPQ (rework) per project and phase to pinpoint quality bottlenecks.
Strategic Insight: Provides a C-level perspective on where time is actually being spent and quantifies the impact of blockers.

Beyond Insights: Triggering Automated Actions
The most significant leap forward is the system's ability to not just generate insights but to trigger automated, intelligent actions. This transforms passive data into proactive management.
We are actively developing capabilities for the system to:
- a. Automatically Send Summary Emails: Managers can receive concise, personalised summary reports for their teams or specific individuals, flagging urgent issues or highlighting positive trends, directly to their inboxes.
- b. Proactive Employee Reminders: Automated nudges can be sent to employees regarding missed submissions, nearing deadlines, or opportunities for skill development.
- c. Dynamic Resource Optimisation: By identifying underutilised or overloaded individuals, the system can suggest reallocations or additional training needs, optimising overall team bandwidth.
- d. Automated Coaching Advice: For employees seeking self-improvement, the system can automatically deliver personalised, data-driven coaching suggestions directly, fostering continuous growth.
Illustration 5: Concept art of an automated email/notification interface. A sleek, modern email interface with a "Daily Workforce Insights" subject line, showing a snippet of an automated summary with a highlighted recommendation.

The Road Ahead: A Vision for the Future of Work
At Dataplatr, we envision a future where workforce management shifts from reactive reporting to proactive, intelligent guidance. By harnessing AI to transform raw task data into deep insights and automated actions, powered by task intelligence, workforce intelligence, and enriched workforce KPIs, we aim to empower managers with clarity and employees with personalised growth opportunities.
This internal initiative sets a new standard for how organisations understand, support, and elevate their most valuable asset: their people.


